

Abstract
Global navigation satellite systems (GNSS) are vulnerable to spoofing attacks. To shut down a spoofer, it is necessary to locate the spoofer first. Many spoofer localization systems use long cables for the synchronization of multiple receivers. However, a flexible spoofer localization system free from cables is sometimes essential so the receivers can move freely and are flexible to deploy. This paper solves two major problems in developing such a system: spoofing discrimination without requiring synchronization and having an effective method using asynchronous raw measurements with no other assistance. First, this paper proposes to use the extended pseudorange double-difference method to discriminate spoofing signals. The performance is then analyzed and the effectiveness is verified. Then, a quasi-synchronization spoofer localization method (QSSL) is proposed, and it is verified that its localization performance can attain the Cramer-Rao lower bound. Above all, a field experiment demonstrates the effectiveness of the proposed methods and the feasibility of such system.
1 INTRODUCTION
Global navigation satellite systems (GNSS) can provide position and timing information and is widely utilized in modern life. However, the security and reliability of GNSSs have been challenged by spoofing attacks recently (Humphreys et al., 2008). Civil GNSS signals are very weak when arriving at the surface of the Earth, and their structures are public. These two facts make spoofing attacks feasible. The field tests in Bhatti and Humphreys (2017), Kerns et al. (2014), and Psiaki and Humphreys (2016a) demonstrate that, due to spoofing, GNSS users can derive falsified position and timing solutions without awareness.
1.1 Spoofing Detection Techniques
In order to alarm victimized GNSS users, spoofing detection techniques have been studied extensively (Günther, 2014; Jafarnia-Jahromi, 2013; Jafarnia-Jahromi et al., 2012; Psiaki & Humphreys, 2016b).
Navigation message authentication (NMA) is a very effective way to defend against spoofing attacks (Borio & Gioia, 2016; Günther, 2014). This technique needs to generate and broadcast cryptographic digital signatures by satellites, making the signal difficult to counterfeit by an unauthorized spoofer (Kerns et al., 2014). Generally, new satellites have to be launched to implement this new function.
While NMA is not yet available, a single-antenna standalone receiver can defend against spoofing by detecting anomalies in signal features, such as abnormal signal power (Akos, 2012), inconsistency between code-based and carrier-based measurements (Chu et al., 2018), distortion of correlation peaks (Pini et al., 2011), or conflict with spatial information from a moving antenna (Broumandan et al., 2016; Wang et al., 2017). Moreover, one can use external information that is not affected by GNSS spoofing. Tanil et al. (2018) proposed a monitor using inertial measurement units (IMUs) to detect GNSS spoofing. Other external information sources include an altimeter, cellular network, ground-based positioning system, and so on (Borio & Gioia, 2016).
Besides single-antenna standalone receivers, researchers also make use of multiple antennas or receivers. In Heng et al. (2015) and Psiaki et al. (2013), the signals from two separated receivers were cross-correlated to detect the absence of encrypted military signals, which would indicate a spoofing attack. Swaszek et al. (2013) monitored if the positioning results of two separated receivers abnormally overlapped each other. In Borio and Gioia (2016), Jafarnia-Jahromi et al. (2014), and Psiaki et al. (2014), double antennas were used to calculate carrier-phase differences for spoofing detection. This method was based on the assumption that spoofing signals come from the same antenna and travel through the same path to a victim receiver, while authentic satellite signals do not. Similarly, Wang et al. (2018) made use of signal power measurements to detect spoofing, and Zhang and Zhan (2018) and our previous work (Wen et al., 2019) utilized code-based measurements.
1.2 Spoofer Localization
Spoofing detection techniques offer active resistance to spoofing for some users, but leave innocent users exposed to danger. Therefore, for the purpose of shutting down spoofers, research must take a step forward and aim to locate such spoofers.
There are two types of spoofer localization techniques. The first one, proposed by Shang et al. (2020), uses only one receiver, which is a major advantage. However, this technique can only deal with a meaconer, which is supposed to record and replay the satellite signals with relatively unchanged delay to produce unbiased spoofer position estimations. In contrast, the other type is based on a localization system that consists of several distributed sensors and uses received signal strength (RSS), angle of arrival (AOA), time of arrival (TOA), time difference of arrival (TDOA), frequency difference of arrival (FDOA) or a combination of the above to locate a signal source (Dempster & Cetin, 2016). This type is more general and has the potential to deal with various spoofers. Since it is easy to get time information from spoofing signals, related works (Bhamidipati & Gao, 2019; Broumandan et al., 2015; Gamba et al., 2016) adopted GNSS receivers as sensors and TOA or TDOA techniques to achieve spoofer localization.
There are two requirements for TOA or TDOA techniques (Dempster & Cetin, 2016). One is high-quality synchronization of sensors, and in Bhamidipati and Gao (2019) and Gamba et al. (2016), long cables were employed for synchronization. The other requirement is that the positions of sensors must be known. Both Gamba et al. (2016) and Bhamidipati and Gao (2019) used static sensors with predetermined positions. However, Broumandan et al. (2015) proposed a different method. First, the signals received by sensors were classified into an authentic group or spoofing group. Then, the position and local time of each sensor were estimated using authentic signals, and all sensors could be synchronized with GNSS time using local time estimations. Therefore, the stated two requirements could be fulfilled. However, the signal classification process in Broumandan et al. (2015) was based on the carrier-phase double-difference method and still requires synchronization of sensors with cables according to Broumandan et al. (2015) and Wang et al. (2018).
Although cables provide precise synchronization, they also limit the application of a localization system. In fact, cables are not necessary for locating a spoofer. Without cables, the sensors can move freely, and a flexible spoofer localization system can be built. Such a system has the potential to track a mobile spoofer, or be implemented on cellular networks or future vehicle networks for finding spoofers in a vast area.
The spoofing discrimination methods based on standalone receivers need no cables, but they can hardly judge whether the spoofing signals received by different receivers are from the same spoofer or not. However, the spoofing discrimination methods based on multiple receivers have the potential to fulfill this function, and this function is important for localization. Moreover, although the two requirements for TDOA or TOA techniques can be fulfilled using authentic GNSS signals, both sensor position and synchronization are inaccurate. To deal with the inaccuracy, Wang and Ho (2013) proposed a closed-form multistage weighted least squares (WLS) algorithm when each sensor had at least one synchronous peer. Zou and Liu (2020) used semidefinite programming methods when an emitter for calibration was available. However, both methods remain relatively complicated and need additional assistance like a synchronous peer or calibration emitter. The method proposed by Broumandan et al. (2015) needs no additional assistance, but the measurements from different sensors are asynchronous, which need to be synchronized before they can be used for localization, and Broumandan et al. (2015) can only fulfill measurement synchronization once every sensor receives at least four consistent spoofing signals.
Therefore, to establish a flexible spoofer localization free from long cables, the first problem to deal with is spoofing discrimination without requiring the synchronization of multiple sensors. Then, another problem is the localization method for estimating spoofer position using asynchronous measurements without additional assistance.
For the first problem, a competitive solution is the code-based pseudorange double difference (PrDD) method proposed in our previous work (Wen et al., 2019). However, the PrDD method is based on merely two receivers, and authentic signals are easily misjudged as spoofing signals under unfavorable relative geometry. In this paper, since more receivers are available for a spoofer localization system, we propose an extended PrDD method that cross-checks the PrDD results of different receiver pairings. Stenberg et al. (2020) also extended carrier-phase and pseudorange double-difference methods, but they still required synchronous multiple receivers. Our extended PrDD method does not need the synchronization of receivers and shows a greatly improved performance, which makes a flexible spoofer localization system possible. The feasibility and superiority of the extended PrDD method will be demonstrated by simulations and a field experiment.
For the second problem, in this paper, we propose a quasi-synchronization spoofer localization (QSSL) method. This method can use asynchronous raw measurements of GNSS signals to form quasi-synchronized TDOA measurements, and then solve TDOA equations using an iterative WLS algorithm to estimate spoofer position. Theoretical analysis and simulation results verify that its localization performance can attain the Cramer-Rao lower bound (CRLB). Compared with previous works, this method lifts the restriction on spoofing signals in Broumandan et al. (2015) and needs no additional assistance like Wang and Ho (2013) or Zou and Liu (2020).
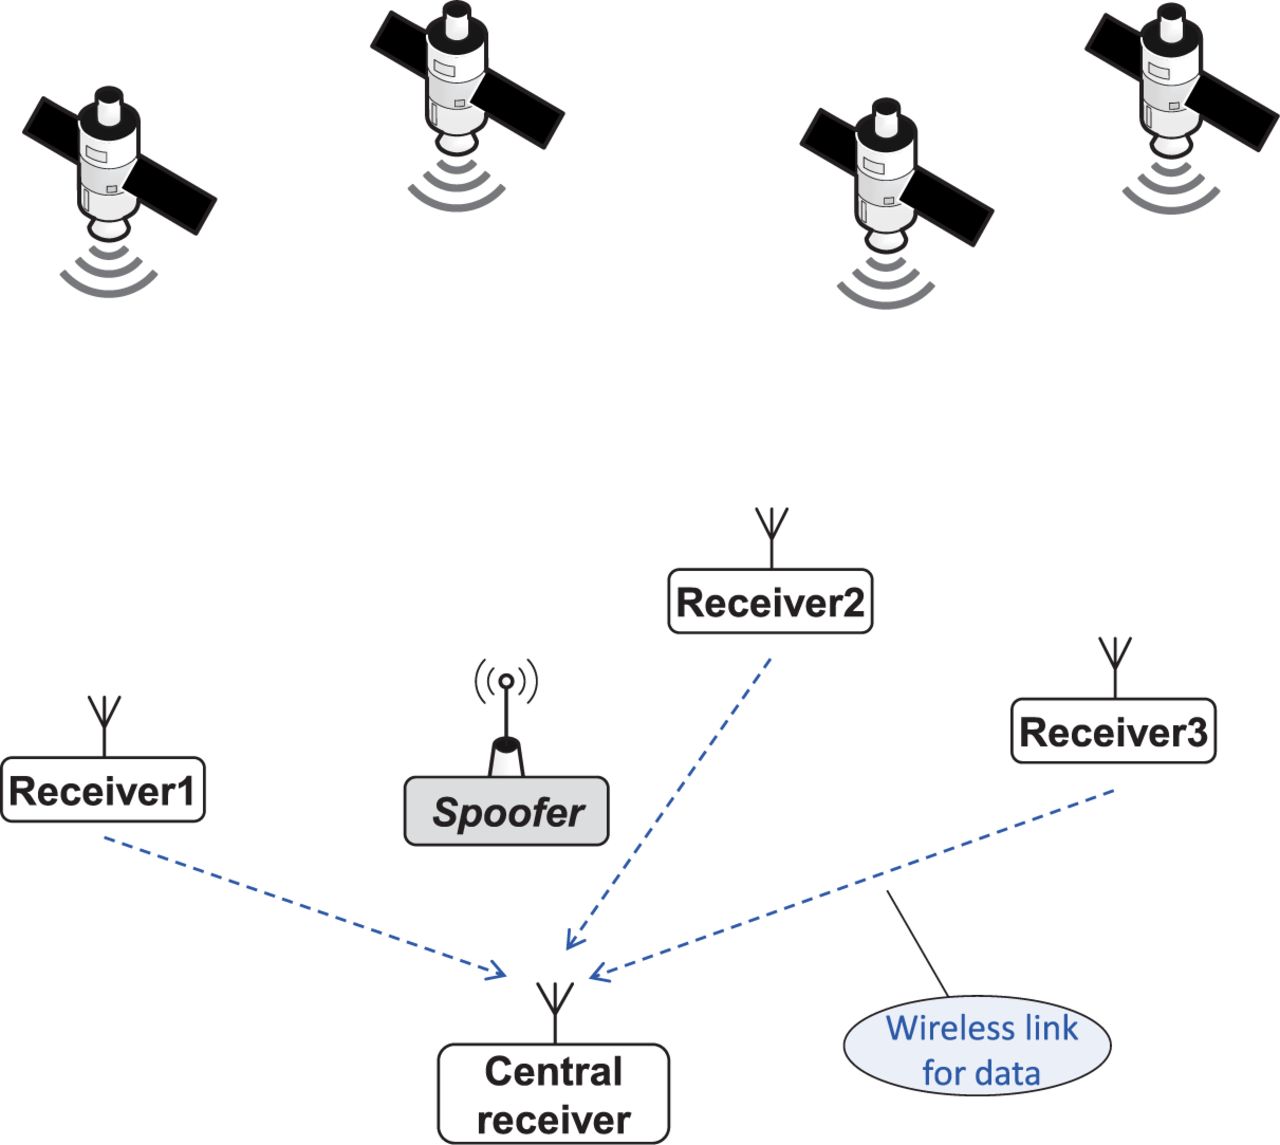
In summary, the schematic diagram of a flexible spoofer localization system is shown in Figure 1. Several independent GNSS receivers are used as sensors, with one of them designated central receiver. All receivers can receive authentic satellite signals, and during a spoofing attack, receivers lying in the affected area will also receive spoofing signals. The receivers obtain raw measurements from both authentic and spoofing signals, including transmit time, pseudorange rate, pseudorandom noise (PRN) code number, carrier phase, and so on. Then, each receiver sends its raw measurements to the central receiver periodically via wireless links. These links are not required to be high-quality in order to be useful for precise synchronization, such as Wi-Fi network communication links, ad hoc peer-to-peer direct communication links, and so on. Afterward, the raw measurements are processed by the central receiver, and the central receiver then uses the extended PrDD method to discriminate spoofing signals from authentic ones, and locate the spoofer using the QSSL method.

A schematic diagram of the spoofer localization system.
This system works on some assumptions. First, as in Borio and Gioia (2016), Broumandan et al. (2015, 2016), Jafarnia-Jahromi et al. (2014), Psiaki et al. (2014), Wang et al. (2017, 2018), Wen et al. (2019), and Zhang and Zhan (2018), a spoofer usually spoofs more than one satellite to successfully deceive others, in which case the spoofing signals contain more than one PRN code and are transmitted by one antenna. Second, a spoofer usually stays stealthy and avoids transmitting signals with overwhelming power, in which case authentic signals are not jammed completely and can be processed by a receiver. Moreover, the total number of received authentic signals by a receiver should be at least four. At last, the total number N of receivers that can receive spoofing signals satisfies N ≥ 4. These assumptions, except the total number of authentic signals, coincide with Bhamidipati and Gao (2019), which also aims to locate spoofers.
1.3 Our Contributions
In this paper, we aim to solve two major problems of a flexible spoofer localization system: spoofing discrimination without requiring synchronization and finding a localization method using asynchronous raw measurements without additional assistance. Contributions of this paper are summarized below.
An extended PrDD method is proposed for discriminating spoofing signals. The performance of this method is analyzed, and the effectiveness is validated by simulations.
A quasi-synchronization spoofer localization (QSSL) method is proposed. We theoretically analyze the spoofer localization performance and verify that the performance can attain the CRLB.
A field experiment is conducted to demonstrate the effectiveness of the proposed methods and the feasibility of this flexible spoofer localization system.
The rest of this paper is organized as follows. Section 2 introduces the extended PrDD method and its performance analysis. Section 3 introduces the QSSL method and deduces the CRLB of the spoofer position estimator. In Section 4, two requisite functions are emphasized and explained briefly. Section 5 presents the field experiment results with discussion. At last, Section 6 draws some conclusions.
Notations: Throughout the whole paper, matrix and column vectors are denoted by bold uppercase and lowercase letters respectively, while a scalar uses an italic font. [⋅]T denotes the transpose of a matrix or vector. [⋅]n×m represents a matrix that has n rows and m columns. tr {⋅} stands for the trace of a square matrix. diag {⋅} represents a diagonal or a block diagonal matrix with its argument lying on the main diagonal in order. ∥⋅∥ is the Euclidean norm of its argument. Superscripts i and j denote the corresponding quantities are related to the i-th and j-th signals, and subscripts n and m denote the corresponding quantities are related to the n-th and m-th receivers (n ≥ 1, m ≥ 1). A quantity with a tilde represents a raw measurement, and a parameter with a hat represents an estimation or observation of the parameter.
2 SPOOFING DISCRIMINATION
Before locating a spoofer, we need to discriminate spoofing signals from authentic ones. In this section, following an overview of the previous PrDD method, the extended PrDD method is introduced, and its performance is theoretically analyzed and validated by simulations.
2.1 Overview of the PrDD Method
Suppose there are two receivers, and each can receive two signals identified by PRN code numbers. When the two receivers are synchronous, they can obtain raw measurements of the signals at the same instant t' and produce a synchronous PrDD as:
 1
1
where ρ (t) is pseudorange at the moment t.
If both signals are spoofing signals and transmitted from the same antenna, they have the same propagation path to each receiver, and  will be equal to zero. For example, in Figure 2,
  of the two spoofing signals is equal to
  , where
  is the real distance from the n-th receiver to the source of the i-th signal. Otherwise, if the two signals come from different sources, the propagation paths of the signals differ, and
  can be other values besides zero. For example, in Figure 2,
  of the two satellite signals is equal to
  , that of the first satellite signal and one of the spoofing signals is equal to
  , and both are not zero. Therefore, spoofing signals can be discriminated by the value of
  .
.
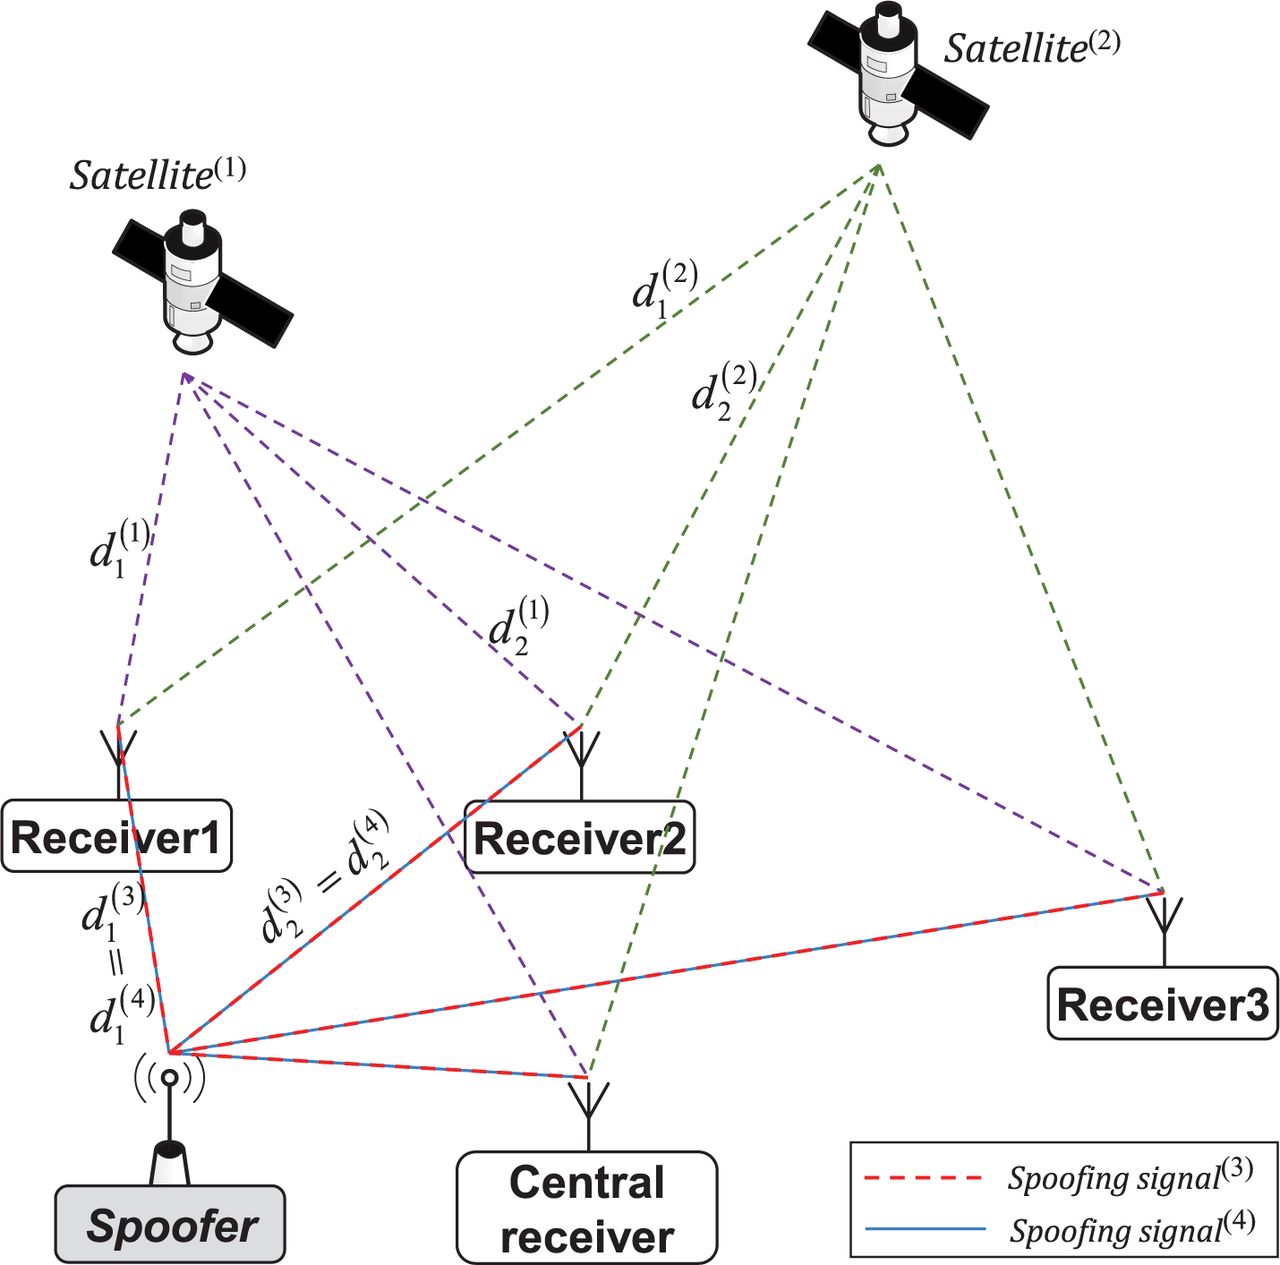
Paths of authentic signals and spoofing signals
However, if the two receivers are asynchronous, they might obtain raw measurements of the signals at two different moments t″ and t′, respectively. Then, an asynchronous direct PrDD is:
 2
2
As explained and demonstrated in our previous work (Wen et al., 2019),  , needs correction to be useful for discriminating spoofing signals. The correction is approximating
  using
using  and pseudorange rate.
In practice, pseudoranges are usually measured by signal transmit time and local time as:
 3
3
where tn is real receiver local time, δtn is the receiver clock bias from reference time,  is signal transmit time measurement, and c is the speed of light. Thus, convert pseudorange to signal transmit time, and the corrected asynchronous PrDD can be calculated by:
 4
4
where  is the pseudorange rate at the moment t, and the last two lines are tire correction to
  . In Equation (4),
  is obtained using two common raw measurements: signal transmit time and pseudorange rate. The latter raw measurement comes from carrier frequency, and the relation between pseudorange rate and carrier Doppler shift is
  , where fD denotes carrier Doppler shift and fT is nominal carrier frequency of signal.
The formation of  in Equation (4) is the same as Equation (12) of Wen et al. (2019), which is approximately equal to
  in Equation (1) and can be used to discriminate spoofing signals based on asynchronous receivers. A detailed derivation of Equation (4) can be found in Wen et al. (2019).
However, due to unfavorable relative geometry, a certain pair of authentic signals could be easily misjudged as spoofing signals. An example is shown in Figure 13(a) and explained in Section 5.1. Thus, to improve performance and make the PrDD method more practical, we extend the PrDD method by using more than two receivers.
2.2 The Proposed Extended PrDD Method
In the spoofer localization system, at least four receivers are available, and it is natural to employ all of them to discriminate spoofing signals. More receivers mean that more spatial information can be obtained, which will improve the performance.
In practice, the central receiver collects periodic raw measurements from each peripheral receiver continuously, and calculates the PrDD for each pair of receivers and each pair of signals using Equation (4). Let  for convenience, where l is an integer and Δt is the interval of two successive sets of measurements. As explained in Section 2.1 about Figure 2, for a pair of spoofing signals, the PrDD of all receiver pairings is equal to zero regardless of noise terms.
Consider two signals denoted by i and j. Based on Wen et al. (2019), when the receivers and spoofer are stationary, spoofing discrimination can be viewed as distinguishing between the two hypotheses:
 5
5
where a and b are uncertain parameters that describe how s changes with time; w is the noise term, a random variable whose probability density function (PDF) is  (0, σ 2) with σ uncertain; 𝔻 = {1, 2, …, N} is a set of integers used for numbering the receivers; and 𝔻2 = {(n, m) |n ∈ 𝔻, m ∈ 𝔻, n < m} is the set of all possible two-receiver combinations.
  represents that both signals are spoofing signals, and
  represents a situation in which at least one of the two signals is authentic. In other words,
  means the total absence of authentic signals, and
  means the presence of them. A similar design was also adopted by Broumandan et al. (2015), Borio and Gioia (2016), and Wang et al. (2018).
There are two situations under  : both signals are authentic, or one signal is authentic and the other is spoofing. Since a satellite keeps moving and the motion is approximately linear in a short period of time, the PrDD under these two situations can be seen as changing linearly with time as described in Equation (5).
According to Kay (1998), given the unknown parameters a, b, and σ, a generalized likelihood ratio test (GLRT) approach is suitable to solve the binary hypothesis testing problem. Suppose there are (2L + 1) available s[l] for each combination (n, m, i, j) and l ∈ [−L, L], L ≥ 1, a test statistic can be derived as:
 6
6
where:
 7
7
 8
8
and I is an identity matrix. To be clear, l is used to number the PrDD measurements, all of which in Equation (7) are from past time but not future. When a decision is to be made, the past (2L + 1) PrDD measurements are collected as in Equation (7) and numbered from −L to L.
For two signals denoted by (i, j), a test statistic is calculated using Equation (6) for each two-receiver combination. Then, for all possible receiver combinations, we compare all the test statistics with a threshold γ to make a decision on  or
or  .
.
When signals i and j are both spoofing,  is distributed as F2,2L–1, an F distribution with 2 numerator degrees of freedom and (2L – 1) denominator degrees of freedom. First, consider only two receivers, such as the n-th and m-th receivers. If
  , it will be decided that both signals are spoofing. Otherwise, an error will be made if
  , which can be seen as a false alarm of the presence of an authentic signal. We define the probability of such error as the probability of false alarm PFA. Therefore, for a given PFA, the threshold can be determined by:
 9
9
where QF (⋅) denotes the right-tail probability function of the corresponding F distribution, and  is the inverse function. The right-tail probability function equals one minus the cumulative distribution function (CDF). Then, the measurements provided by other receivers are used following the same rule. Finally, we decide on
  . Alternatively, an overall test statistic can be expressed as:
 10
10
and decide  if T(i, j) < γ.
The above rules show how to make a decision about either of the two signals, and the same rules should be followed for all possible signal combinations. Afterwards, all the signal combinations that lead to an  decision should be designated as spoofing signals, while the remainder of signals should be seen as authentic.
Since we need to test every signal combination one by one, it is necessary to evaluate the complexity of this method. For a given L, the matrix F can be seen as constant, and F(FTF)−1FT needs to be calculated only once. Besides, each element of s is calculated by Equation (4), of which the complexity is 𝒪(1). Therefore, the complexity of calculating test statistics using Equation (6) is 𝒪(L2). Suppose there are in total Mall signals of each receiver to be tested, and then to finish the test we need to calculate Equation (6) for  times. Therefore, the complexity of testing these signals is
  .
.
2.3 Performance Analysis and Simulation Results
Generally, for a given threshold γ, the probability of detection PD can be used to evaluate the performance of the GLRT detector. PD is defined as the probability of deciding  when
when  is true, which means a successful detection of the presence of an authentic signal. For two signals denoted by (i, j):
 11
11
When  is true,
  is distributed as
  , a non-central F distribution with 2 numerator degrees of freedom, (2L – 1) denominator degrees of freedom, noncentrality parameter λ, and:
 12
12
Therefore, PD is affected by λ and γ. More precisely, according to Equations (9) and (12), it is affected by the total number of used measurements (2L + 1), PFA, and the three unknown parameters a, b, and σ. Among these factors, a and b are decided by two factors: time difference tB = t′ − t″, and the relative geometry of receivers, satellites, and spoofer. σ denotes the uncertainty of noise term w in Equation (5).
According to the model given in Equation (1),  can be modeled as:
 13
13
where  and the relatively small random errors in
  are ignored. Thus, there may be a correlation between two test statistics, such as
  and
and  , since
  correlates with
  . In consequence, it is very difficult to determine the probability in Equation (11) analytically or numerically, so we will use simulation results to evaluate PD as proposed in Kay (1998).
First, a simulation is performed to show the influence of correlation. We take the Global Positioning System (GPS) L1 C/A code signal as an example. Suppose four receivers are placed as shown in Figure 3, forming a regular triangle with one of the receivers at the very center. The altitude is 100 meters, and Receiver 1 is placed at 116°E, 40°N. The distance between Receiver 1 and Receiver 2 is denoted by g. Assume the time is 5:30 on June 17, 2020 (GPS time). Ephemeris of a past time is public on the internet, and the positions of satellites in view can be calculated accordingly. We choose two satellites with the PRN code numbers of 1 and 22 and run Monte Carlo simulations for 105 times. The model in Equation (13) is used to add Gaussian noise to PrDD measurements, and we assume each term at the right side has independent and identical distribution in the simulation. Thus, when we set  to σ′, the distribution of
  will be
  . Then, the correct GLRT decisions are counted, and the frequency of them is regarded as empirical PD. The results are shown in Figure 4, and the empirical PD is labeled as Simulation. If
  in Equation (11) is assumed independent of each other, PD will become:
 14
14
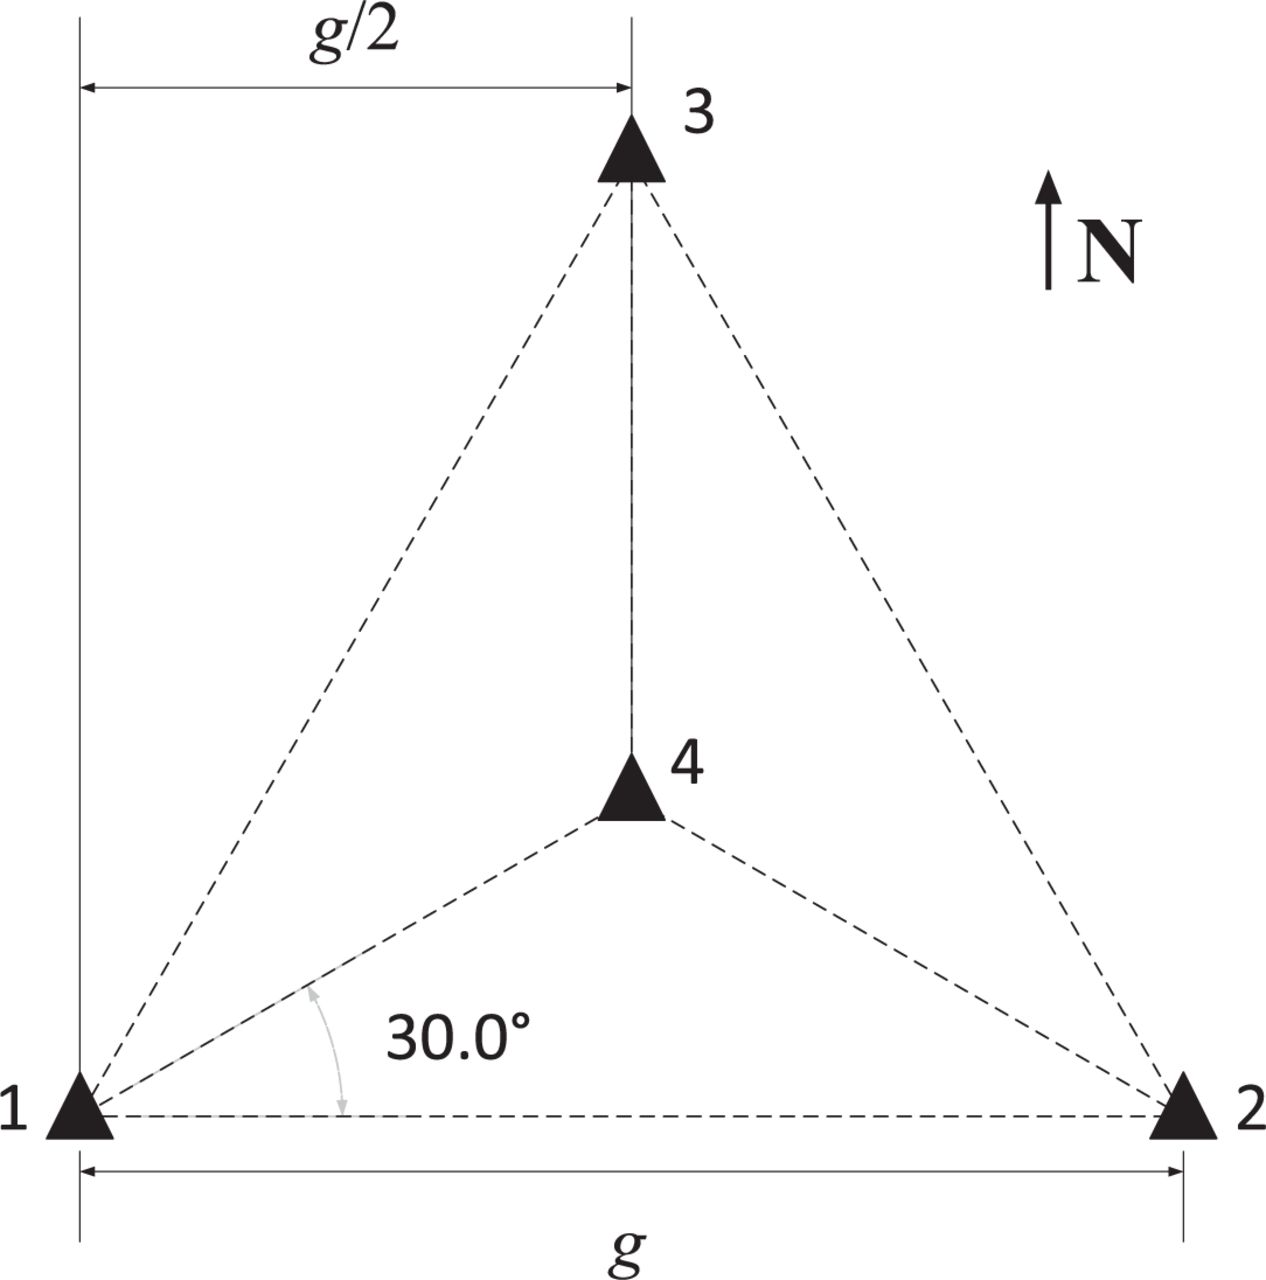
Receiver arrangements on the ground in the simulations
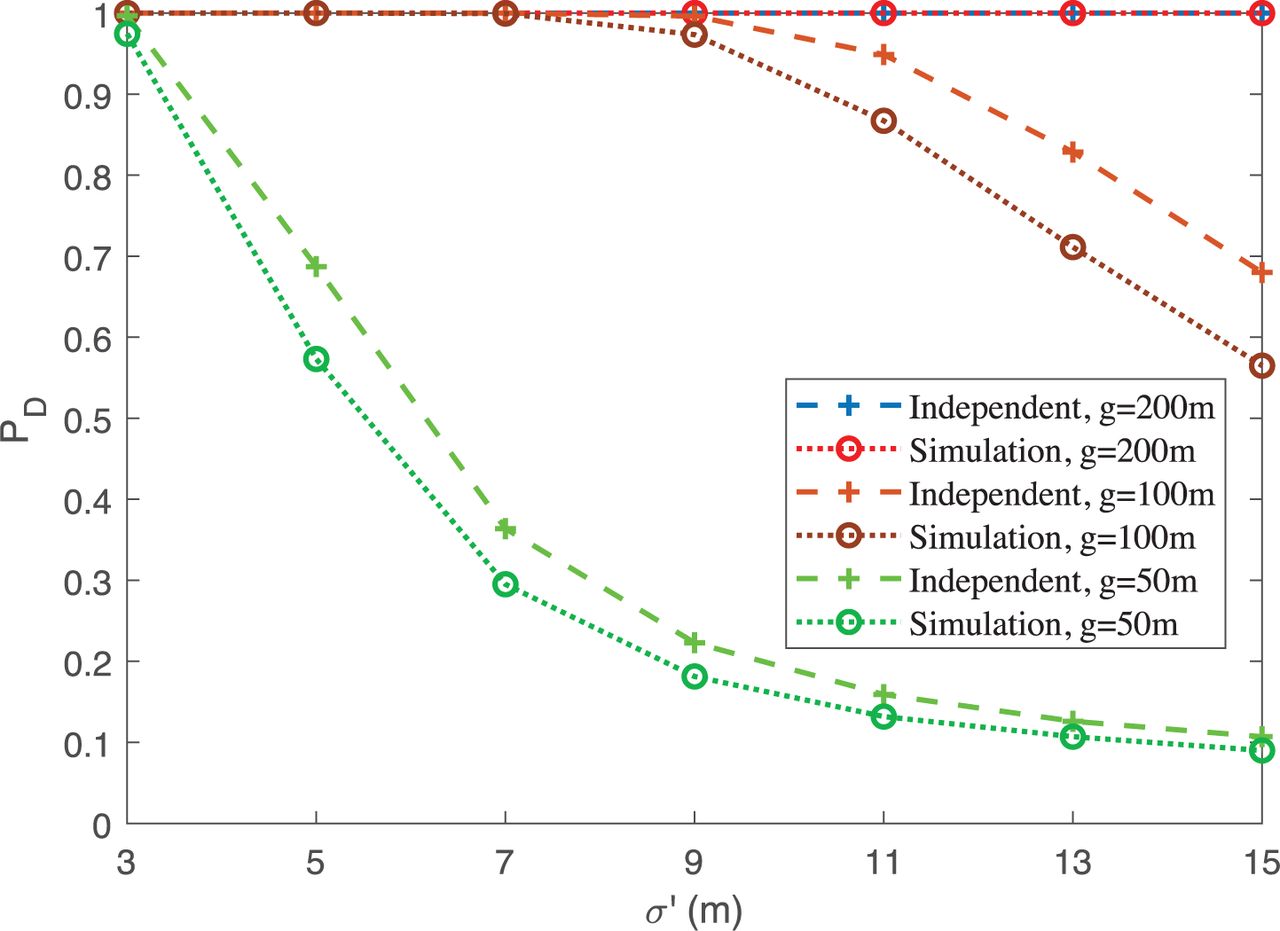
Comparison between Pind and empirical PD, when PFA = 0.01, L = 30, and tB = 100 ms
the values of which are labeled as Independence in Figure 4. The results show that the correlation of test statistics would decrease PD in this situation, compared with assumed independent test statistics. However, if at least one of the  is large enough, PD will approximate one regardless of the correlation, such as the red dotted line with circle markers in Figure 4.
It should be noted that the probability PFA in Equation (9) is not about the overall test statistic in Equation (10). It is about a two-receiver combination test statistic, and is used to determine the threshold γ. The overall probability of false alarm can be expressed as:
 15
15
Due to the correlation in Equation (13), it is also difficult to determine this probability analytically or numerically. Therefore, another simulation is carried out based on the settings in Figure 4. The model in Equation (13) is also used to produce the noise under  , then count the incorrect GLRT decisions on
  , and use the frequency of these decisions as empirical
  . By sliding the threshold γ in a certain range, we can get the results shown in Figure 5, which shows the overall detector operating characteristics in this specific situation.

Overall detector operating characteristics, when g = 100 m, L = 30, and tB = 100 ms
As can be seen in Equation (11), the more usable receivers 𝔻 includes, the more elements 𝔻2 has, and the larger PD will be. Therefore, more simulations are run based on the simulations above to show to what degree an additional receiver can improve performance compared with two receivers, and moreover, how the factors mentioned above affect the performance. For a certain pair of signals, there are two situations under  : both are authentic, or one is authentic and the other is spoofing. The simulations are based on these two situations, respectively.
In the following simulations, since PD is affected by the relative geometry between satellites and receivers, we consider all possible signal combinations at a specific time, and the time is set to every 15 minutes from 00:00 through the whole day of June 17, 2020 (GPS time). Thus, there are in total 96 intervals, and each interval generates a group of PrDD measurements. We use the same method as above to add random noise, and run 2 × 10⁵ times simulations for each PrDD measurement. Then, we count the correct GLRT decisions and treat the frequency as PD. At last, without loss of generality, we find the minimum PD of the 96 groups of PrDD measurements to evaluate performance.
First, consider there is no spoofing attack, and all the signals that are received by the receivers are authentic. Under the conditions, set PFA to 0.01 and L to 30, and then we get the results shown in Figure 6. There are nine curves in this figure, in the legend of which N = 2 means only Receiver 1 and Receiver 2 are used for simulation, i.e., 𝔻 = {1, 2}, N = 3 means 𝔻 = {1, 2, 3}, and N = 4 means 𝔻 = {1, 2, 3, 4}.

Minimum PD during a whole day, while PFA = 0.01 and L = 30, without spoofing signals
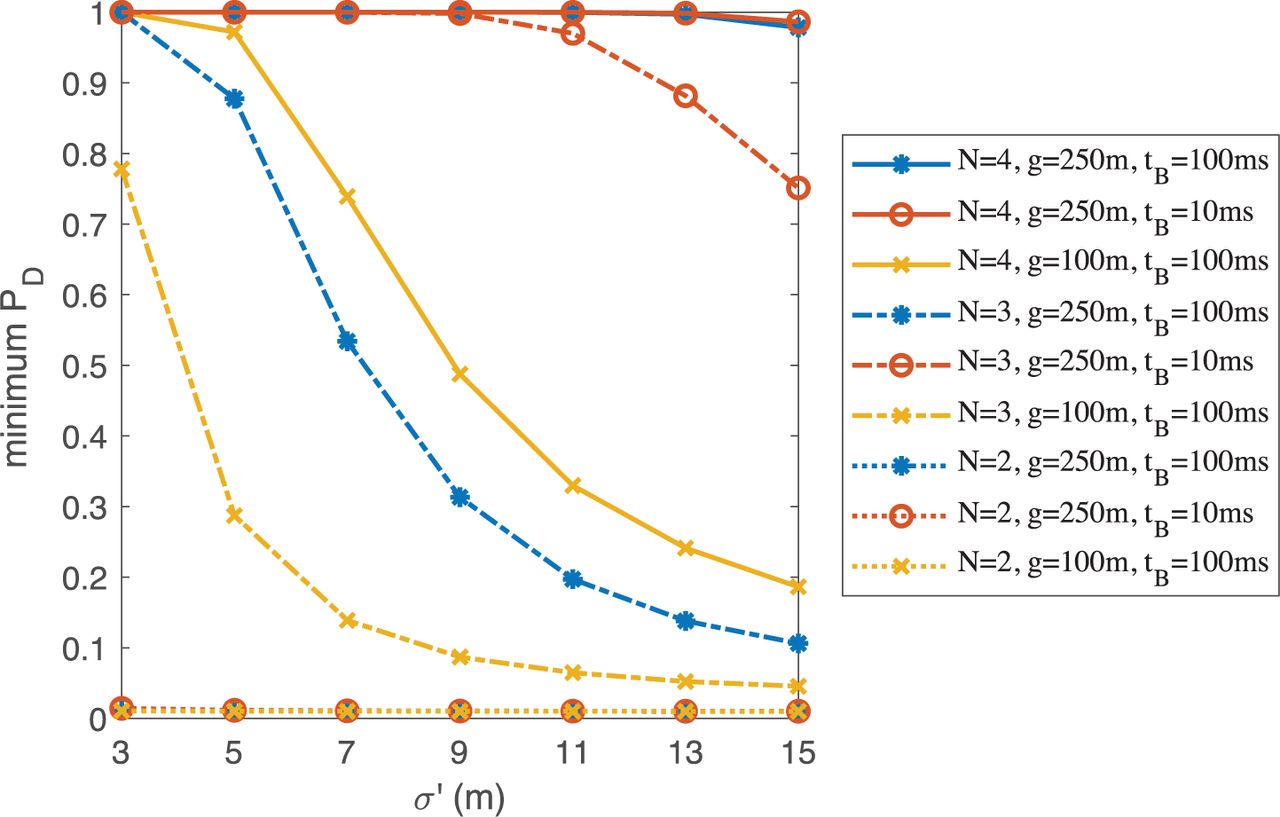
While setting g to 200 m and tB to 100 ms, simulation results are shown in Figure 7. When only two receivers are used, the minimum PD is close to zero in all cases, which means there are always two authentic signals that will most possibly be misjudged as spoofing signals. However, when three or four receivers are used, the performance can be improved greatly, and especially, the blue curves with an asterisk marker show in that case that authentic signals can be correctly recognized with high confidence during the whole day. Besides, increasing L, g, or tB is beneficial to improving performance. The influence of tB is not readily intelligible, and a brief explanation is that, although tB is usually not controllable, increasing tB tends to magnify the double difference in satellite distances and thus leads to a bigger absolute value of the PrDD and a better performance.

Minimum PD during a whole day, while g = 200 m and tB = 100 ms, without spoofing signals
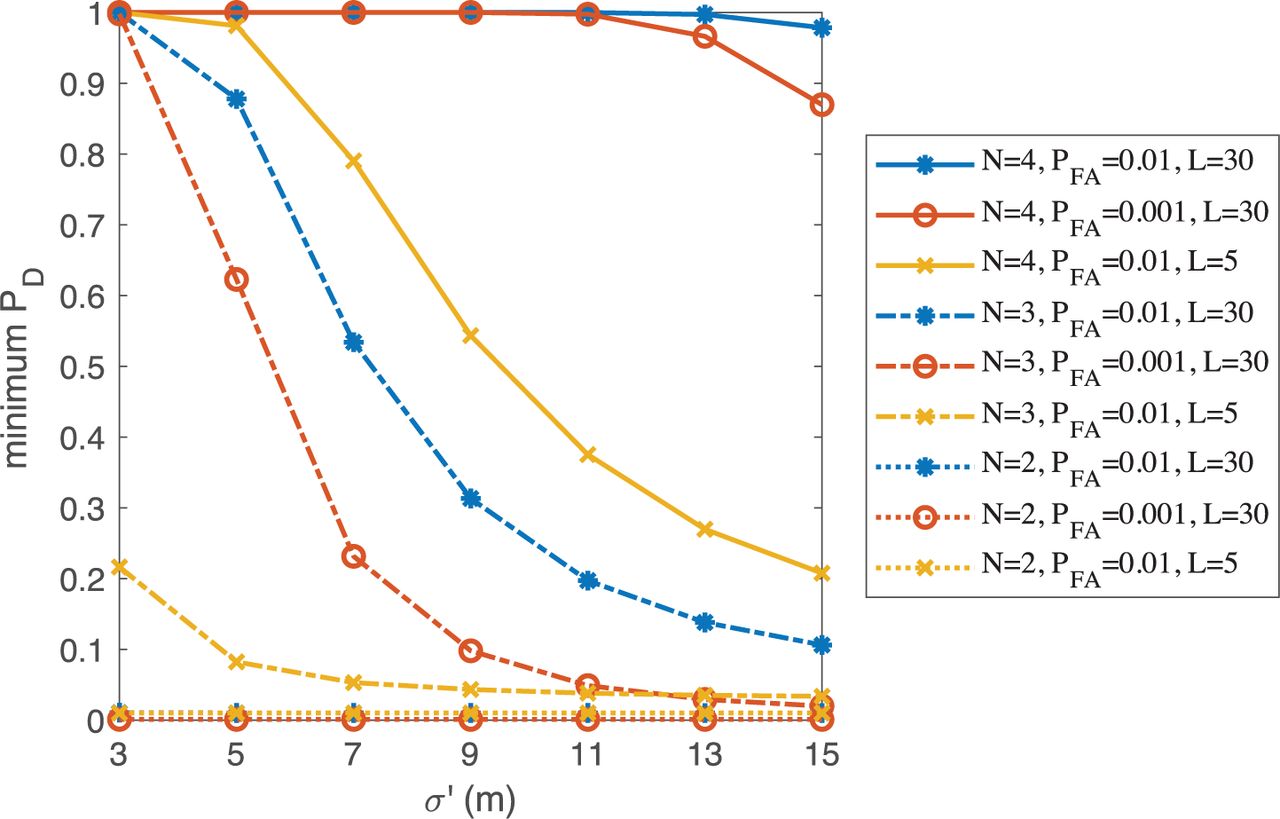
Next, consider there is one spoofer. Generally, the spoofer position is unpredictable. We simply put the imaginary spoofer at 115.995°E and 39.995°N with an altitude of 150 m. The distance between the spoofer and Receiver 1 is about 700 m, and the elevation angle of the spoofer is about 4.07° from Receiver 1. The spoofer is assumed to replay the signals from GPS satellites without delay. Here, we only consider signal pairings that are composed of one authentic signal and one spoofing signal. Figure 8 shows the simulation results when we set PFA to 0.01 and L to 30, and Figure 9 shows the results when g is set to 250 m and tB = 100 ms. Similarly, the minimum PD is also close to zero in all cases when using only two receivers, but using more receivers and increasing L or g still improves performance. However, in this situation, to attain comparable performance to that in Figure 6 and Figure 7, g has to be increased. Sometimes the direction of the spoofer is very similar to that of a certain satellite, and consequently, this method cannot distinguish the signal of this satellite from spoofing signals with full confidence, while two satellites typically do not have similar directions. The influence of g is much more significant in Figure 8, because the spoofer is much closer to the receivers than the satellites and increasing g greatly improves the relative geometry. However, increasing tB does not yield any benefit for performance at all, because in that case, the difference in distances between this satellite and either of the two receivers is so close to that of the spoofer that there is little double difference to be magnified by tB.
Minimum PD during a whole day, while PFA = 0.01 and L = 30, with spoofing signals

Minimum PD during a whole day, while g = 250 m and tB = 100 ms, with spoofing signals
Thus, to make better use of this method, it is suggested to use more receivers and increase the distance between them as much as possible. Besides, improving the accuracy of the measurements, i.e., decreasing σ, is certainly helpful.
In summary, by using multiple receivers, the extended PrDD method is superior to the previous PrDD method based on only two receivers. The simulation results show that this method can discriminate spoofing signals with high confidence at any point in a day. Furthermore, the effectiveness of this method has also been verified by a field experiment described later in Section 5.1.
3 SPOOFER LOCALIZATION
After successfully discriminating spoofing signals from authentic signals using the extended PrDD method, the central receiver now knows which measurements are from spoofing signals and which measurements are from authentic signals, and then it can calculate spoofer position using the QSSL method.
The QSSL method takes the following steps. Since the position and local time of each receiver are still unknown, the first step of this method is to solve these unknown variables of each receiver using the measurements of authentic GNSS signals. Then, the second step is to estimate quasi-synchronized TDOA measurements using spoofing signals, which is to estimate distance differences from the spoofer to receivers. At last, the spoofer position can be estimated by solving the resulting TDOA equations using an iterative WLS algorithm.
In order to successfully accomplish the first step, each receiver needs to have the ability to process both spoofing and authentic signals, even if they have the same PRN code numbers. More details about this ability can be seen in Section 4. As is assumed at the end of Section 1.2, in the set of measurements from a receiver, at least four authentic signals are included. In other words, a receiver that captures less than four authentic signals is not usable in the following proposed spoofer localization process.
3.1 The QSSL Method
Suppose there are N usable receivers, the unknown true position of the n-th receiver is pn = [xn, yn, zn]T, n = 1, 2, …, N, and a spoofer is located at p0 = [x0, y0, z0]T. The distance of the spoofer from the n-th receiver is denoted by rn ∥pn = − p0∥, and the difference between rn and rm is denoted by rn,m = rn − rm.
First, we use the raw measurements of authentic GNSS signals to estimate each receiver’s position pn and local time bias δ tn. According to Kaplan and Hegarty (2005) and later Xie (2009), this can be done by solving the equation:
 16
16
where p(i) denotes position of the i-th satellite and is regarded as precisely known from GNSS ephemeris. δ tn and  are defined in Equation (3), in which tn and δ tn are not known, but tn + δ tn is known as biased local time. Thus, after solving Equation (16), we get unbiased estimations
  and
and  . Then, local time estimation of the n-th receiver is
  .
.
Next, we must estimate the range difference rn,m between two receivers and the spoofer, which is to obtain TDOA measurements and transfer that TDOA data into a range difference. Since the receivers are not accurately synchronized, the raw measurements from different receivers may be obtained at different moments, but TDOA techniques require that the raw measurements be obtained at the same time. Thus, two special processes of raw measurements are needed. First, the pseudorange rate should be employed to transfer the difference of transmit time into a difference of distance. Second, the TDOA measurement needs to be synchronized using  , and since
  is inaccurate, the TDOA measurement is quasi-synchronized. Therefore, let the index n of the central receiver be one, and using the measurements of the i-th spoofing signal, rn,1 can be estimated by:
 17
17
The deduction of Equation (17) is given in Appendix A. Then, including the measurements of all the other spoofing signals, the final estimation of  is a weighted average of
  as:
as:
 18
18
where  is the positive weight determined by the covariance of all
  , and
, and  .
.
Here, the estimation  is seen as inaccurate since it has random errors in it. As is known,
  can be as accurate as tens of nanoseconds. The random errors in
  will go into
  and then
  . Tens of nanoseconds multiplied by c mean several to more than ten meters in terms of length. Such a level of random errors cannot be neglected, especially when the spoofer is not as far from the receiver. However, an accurate synchronization achieved by long cables would not bring such random errors. Therefore, the TDOA measurement obtained above is called quasi-synchronized.
With all the prior estimations, including receiver positions  and range differences
  , TDOA equations can be formed as:
 19
19
If we have more than three equations, i.e., N ≥ 4, an estimation  of the unknown spoofer position p0 can be obtained by solving these equations. We make use of an iterative WLS algorithm as follows. First, we decide on an initial guess of spoofer position
  . Second, we linearize Equation (19) by first-order Taylor series expansions about
  , and the (N – 1) equations can be expressed in matrix form as G0 Δp = Δr, where G0 is given in Equation (26), Δr is given in Equation (29), and
  . Third, estimate Δp as:
 20
20
where W0 is a weighting matrix. Finally, we return to the second step, replace  with
with  , iterate until convergence, at which point an estimation
  can be obtained. The mean square error (MSE) matrix is
  .
.
By now, the main purpose of locating the spoofer has been achieved. However, due to the existence of the spoofer, the previously obtained  and δ
and δ  can be refined by jointly solving Equation (16) and (19), which means to jointly estimate:
 21
21
Still, an iterative WLS algorithm is introduced. First, since we have got an estimation  as well as
  and
and  , which can be denoted by:
 22
22
it is natural to use them as the initial guess. Second, linearize Equation (16) and (19) by first-order Taylor series expansions about  , and the equations can be expressed in matrix form as:
 23
23
where:
 24
24
 25
25
and  . Let [⋅]k represent the k-th row of a matrix or the k-th element of a column vector. Then, when 1 ≤ k ≤ (N – 1):
 26
26
 27
27
 28
28
 29
29
and when 1 ≤ k ≤ Mn (Mn is the total number of available authentic signals of the n-th receiver):
 30
30
 31
31
Third, estimate ∆θ as:
 32
32
where W is weighting matrix. Fourth, replace  with
with  return to the second step, and iterate until convergence. Now, a refined estimate of θ can be obtained, and its MSE matrix is
  . All the estimations in
  can attain the CRLB by selecting the right weighting matrix, which is detailed in Section 3.2.
3.2 Localization Accuracy Analysis
This subsection will analyze the CRLB of an unbiased spoofer position estimator.
In this problem, unknown parameters, given by θ in Equation (21), include spoofer position, receiver position, and receiver time. The observations include spoofer range difference  and pseudorange
  , where
  . The random errors in
  and
and  are assumed jointly Gaussian, respectively.
  includes measurements of spoofing signals, and
  includes those of real satellite signals. Spoofing signals and real satellite signals come from different sources, and thus we assume the measurement errors of spoofing signals and that of authentic signals are independent. Therefore, the PDF is:
 33
33
where C is a constant, ε = [ε2,1,ε3,1,···,εN,1]T is an error vector with its elements being:
 34
34
 , Qr is the covariance matrix of ε, and Qp is the covariance matrix of
  . Then, the log-likelihood function is:
 35
35
Thus, the Fisher information matrix (FIM) is:
 36
36
where:
 37
37
When J (θ) has full rank, the covariance matrix of any unbiased estimation of θ is bounded below by J–1 (θ).
Since all raw measurements are assumed to be unbiased and have independent Gaussian distributions, the WLS estimation of θ is also unbiased. Let  , and then
  , which means this estimation attains the CRLB.
According to Shen and Win (2010) and Shen et al. (2010), the equivalent Fisher information matrix (EFIM) of spoofer position is given by:
 38
38
and  equals the upper left 3 × 3 submatrix of J–1 (θ). Thus, the covariance matrix of any unbiased estimation of p0 is bounded below by
  .
.
According to Cao et al. (2015) and matrix inversion lemma in Zhang (2017), substitute Equation (37) into (38), and then:
 39
39
where:
 40
40
Therefore, let  , and then the
  about Equation (20) is equal to
  regardless of the errors in G0. As explained in Ho et al. (2007) and Wang and Ho (2013), the decrease in localization accuracy due to errors in G0 is insignificant. We will verify through simulation in Section 3.4 that, when the errors in
  and
and  are not large, the estimation of Equation (20) also attains the CRLB.
3.3 Localization on the Same Height
This subsection considers a special situation in which all the receivers and the spoofer are of the same height, such as on the surface of the ground or sea. In that case,  in Equation (20) does not exist, and estimating p0 is impossible.
To successfully estimate spoofer position, the information about height should be made use of, which can be formulated by:
 41
41
where h0 denotes the height of spoofer, and hn denotes the height of the n-th receiver. Then, at first, we determine the geodetic coordinates of both receivers and the spoofer, which means to calculate longitude, latitude, and height  of
of  and
and  of
of  (Hegarty & Kaplan, 2005). Second, linearize Equation (41) about
  , and then we have:
 42
42
At last, we put Equation (42) together with Equation (23), continue the iterative WLS algorithm until convergence, and then θ can be estimated.
3.4 Simulation
In this subsection, another simulation is carried out to compare the performance of the WLS algorithm with the CRLB. Consider the four receivers in Figure 3 while g = 200 m. A spoofer is right above Receiver 1 with its altitude at 200 m. The time is assumed 12:00 on June 17, 2020 (GPS time). For convenience, suppose Qρ = I and Qr = ν 2I + ν 2U, where U is a matrix with all its entries equal to one. According to Shen and Win (2010) and Shen et al. (2010), the trace of MSE matrix can be called average squared position error (ASPE) as  , and squared position error bound (SPEB), an alternate form of the CRLB, is
  . Then, ASPE is bounded below by SPEB based on the properties of matrix trace, and Figure 10 depicts their curves under different values of ν, where ASPE are the results of l05 simulations. It can be seen that the performance of the WLS algorithm attains the CRLB in this case.

Comparison of SPEB and ASPE of spoofer position estimation
4 REQUISITE SIGNAL PROCESSING
This section emphasizes two special but necessary functions that ensure the feasibility of this spoofer localization system.
First, one of the assumptions introduced in Section 1 is that the receivers can track both authentic and spoofing signals at the same time. However, when a spoofing signal has the same PRN code number of an authentic signal, common receivers usually track only the stronger signal. This problem was analyzed in Section 4.6.2 of Jafarnia-Jahromi (2013), and under the circumstances, there were multiple correlation peaks for a certain PRN code number during acquisition. One solution proposed in He et al. (2017) is to track each correlation peak and obtain raw measurements respectively as usual. Another solution in Humphreys et al. (2008) and Wesson et al. (2011) is to first remove the strong signal and then perform acquisition again for the same PRN code number, so that the weak vestigial signal can be tracked. Using these methods, the receivers should track every signal that they detect and obtain raw measurements of each signal. In this case, a signal is not only identified by PRN code number, but also FIGURE 10 Comparison of SPEB and ASPE of spoofer position estimation by an additional peak number that should be given to it to distinguish different peaks from one another. Then, all the raw measurements, including peak numbers, would be sent to the central receiver for spoofing discrimination and spoofer localization.
The other function is to check the consistency of the code rate and carrier frequency. Under stable ionospheric conditions, the proportion of carrier frequency to code rate remains fixed. For example, the proportion is 1,540 : 1 in terms of GPS L1 C/A code signal. In Equation (4), τ (t) is a measurement from code,  is from carrier, and thus the consistency is required for the extended PrDD method to work. If consistency is not kept for a spoofing signal, the solution in Section 5.4.1 of Jafarnia-Jahromi (2013) can be used to discriminate the signal as spoofing.
These two functions should be performed by each receiver before raw measurements are sent to the central receiver.
5 EXPERIMENT AND RESULTS
To demonstrate the feasibility of this system, we conducted a field experiment in Tsinghua University on February 5, 2021.
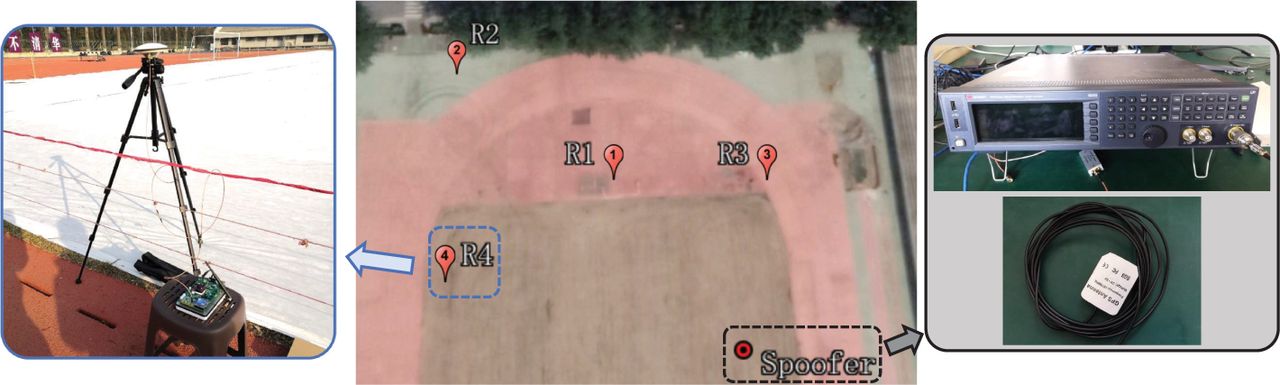
Four homemade GPS receivers were deployed as shown in Figure 11. They could receive and process GPS L1 C/A code signals. Receiver 1 was designated as the central receiver, and the distances between Receiver 1 and the others were about 43.2 m, 32.5 m, and 40.4 m, respectively. The receivers worked individually and were equipped with long-term evolution (LTE) wireless communication modules. Every second, each receiver obtained a set of raw measurements and sent them to Receiver 1 via LTE link. Receiver 1 collected the raw measurements from other receivers and undertook the subsequent data processing. A signal generator was used as spoofer. Three signals were simulated by the signal generator and transmitted by a small antenna, with their PRN numbers being 17, 19, and 28. We limited the signal power to a weak level, trying not to make trouble for users beyond this area. The available GPS satellites are shown in Figure 12. There are eight satellites labeled with their PRN numbers, and the small gray arrows designate their moving directions.

Deployment of the GPS receivers in the field experiment

Sky plot of available satellites of GPS during the field experiment
5.1 Results of Spoofing Discrimination
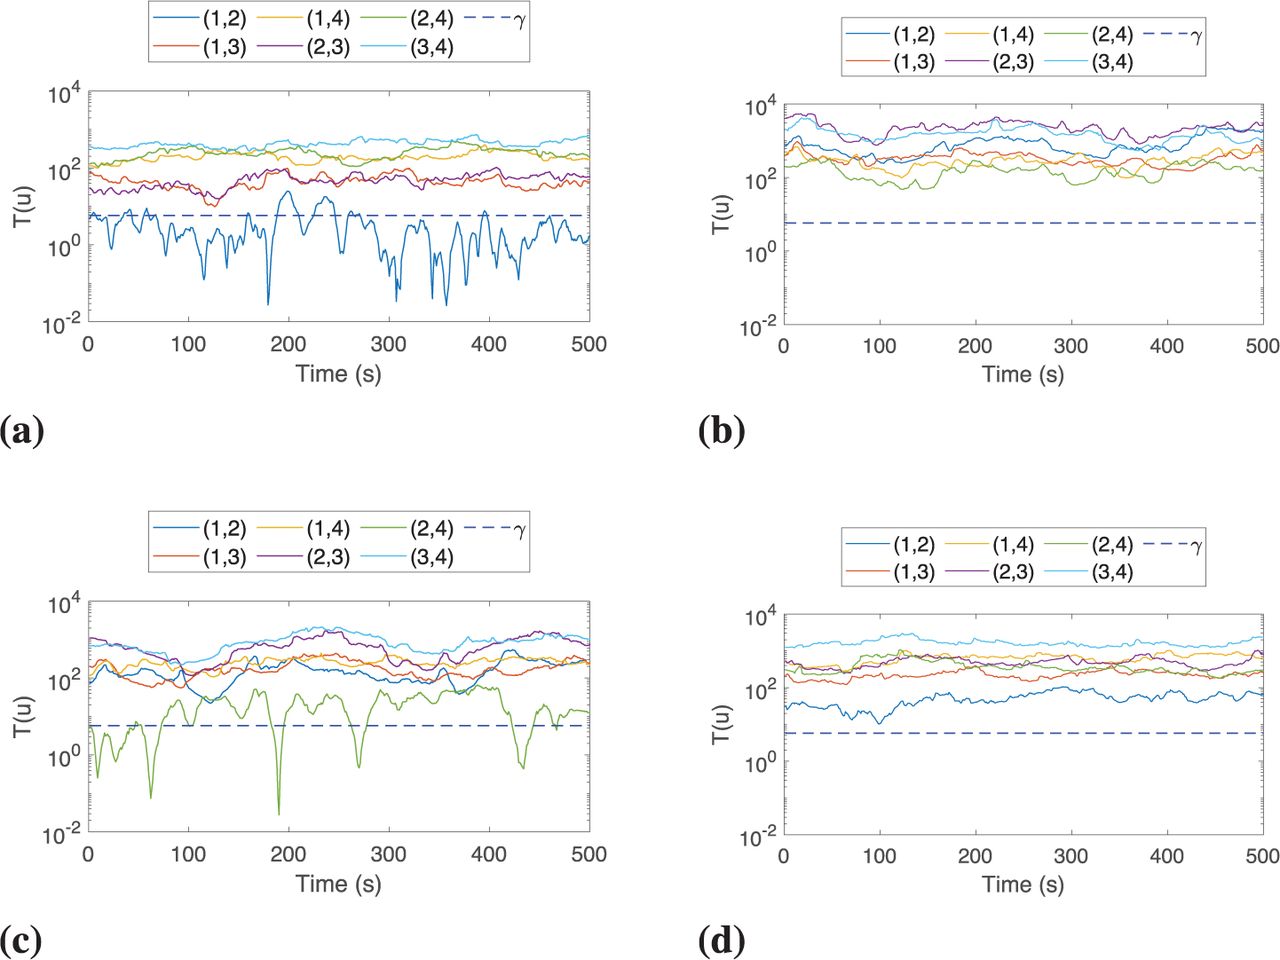
When L is set to 30, Figure 13 shows the test statistics in Equation (6) of four pairs of authentic signals for 500 seconds of continuous time. There were four receivers, so there were six different combinations of the two receivers. Each receiver combination produced a series of test statistics, so there are six curves in each subfigure, in the legend of which (n, m) represents the combination of the n-th receiver and the m-th receiver. Set PFA to 0.005, and the straight dashed line shows the threshold derived from Equation (9). In Figure 13(a), one of the curves appears beneath the threshold most of the time, which corresponds to the combination of Receiver 1 and Receiver 2. Thus, these two receivers would decide that this pair of signals, PRN-16 and PRN-26, were spoofing signals, while actually they were not. This is because the satellite of PRN-16 had approximately equal distance from Receiver 1 and Receiver 2, and so did the satellite of PRN-26. The relative geometry of the two satellites and the two receivers was thus unfavorable. Therefore, the value of the PrDD was about equal to zero and resulted in incorrect decisions. However, after cross-checking with other receivers, this pair of signals would be correctly recognized, which shows the superiority of the extended PrDD method. As a result, over the duration of the experiment, all pairs of authentic signals were correctly recognized.

Examples of GLRT results of a pair of authentic signals: (a) Test statistics of PRN-16 and PRN-26; (b) Test statistics of PRN-22 and PRN-32; (c) Test statistics of PRN-22 and PRN-26; and (d) Test statistics of PRN-26 and PRN-31
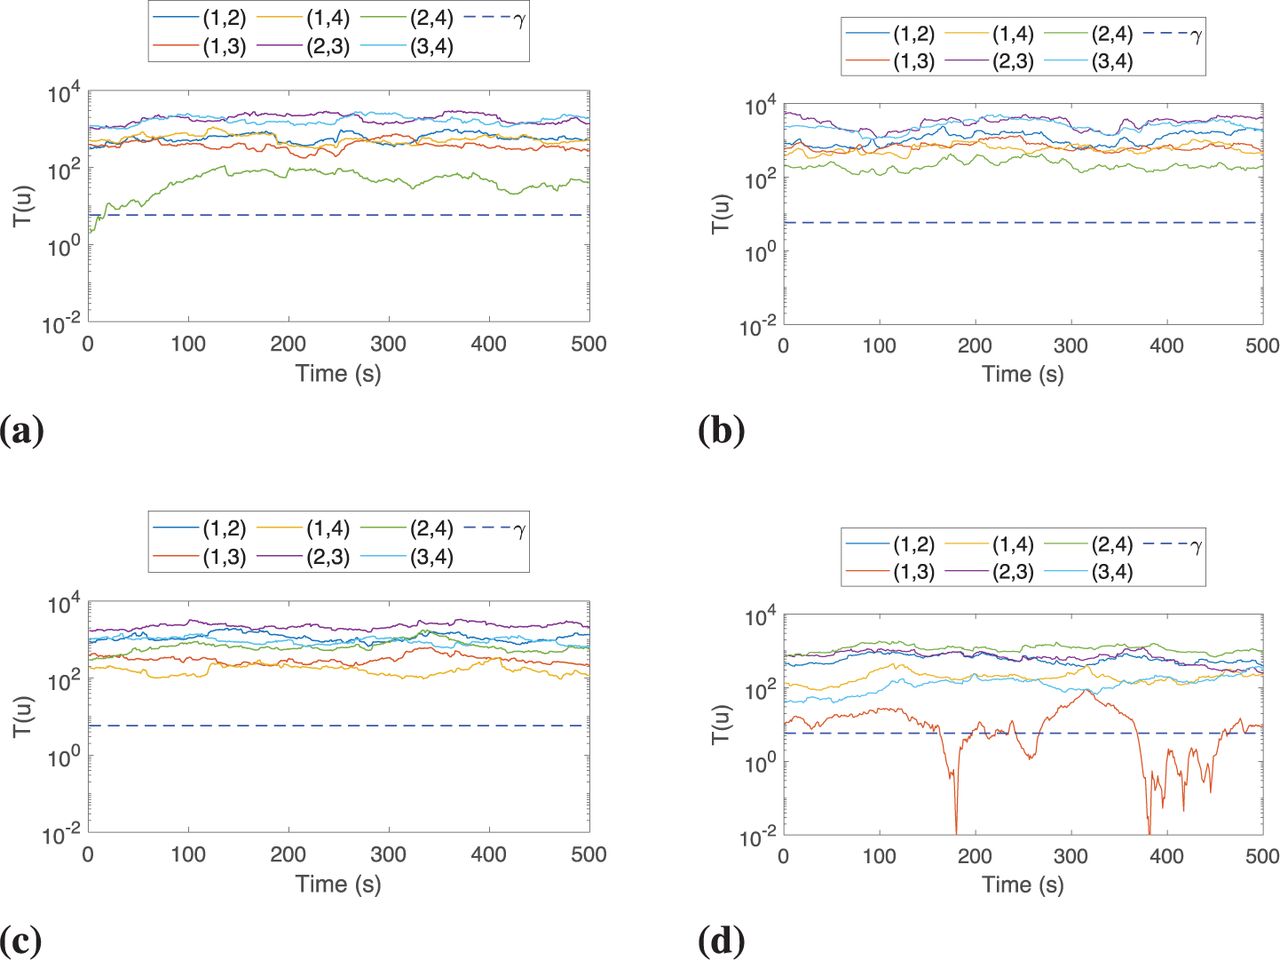
When a signal combination is composed of an authentic signal and a spoofing signal, the extended PrDD method can also make correct decisions as shown in Figure 14. In each subfigure, there is at least one curve that stays greater than the threshold the whole time, and thus  is decided for these four pairs of signals. However, there is one exception shown in Figure 15. Since the azimuth of the satellite of PRN-32 is similar to that of the spoofer, the test statistics of all receiver combinations fluctuate near the threshold as shown in Figure 15(a), Figure 15(c), and Figure 15(e). Thus, there were occasional incorrect decisions as shown in Figure 15(b), Figure 15(d), and Figure 15(f), where, in terms of the vertical axis, one means
  is decided and zero means
  is decided. It is expected that
  is decided for these three pairs of signals, but sometimes
  is decided by mistake. As a result, all signal combinations of a spoofing signal and an authentic signal (except PRN-32) can be correctly recognized during the experiment, and the signal combinations of PRN-32 and a spoofing signal can be correctly recognized most of the time of the experiment.

Examples of GLRT results of an authentic signal and a spoofing signal: (a) Test statistics of PRN-16 and PRN-28; (b) Test statistics of PRN-22 and PRN-17; (c) Test statistics of PRN-26 and PRN-19; and (d) Test statistics of PRN-31 and PRN-28
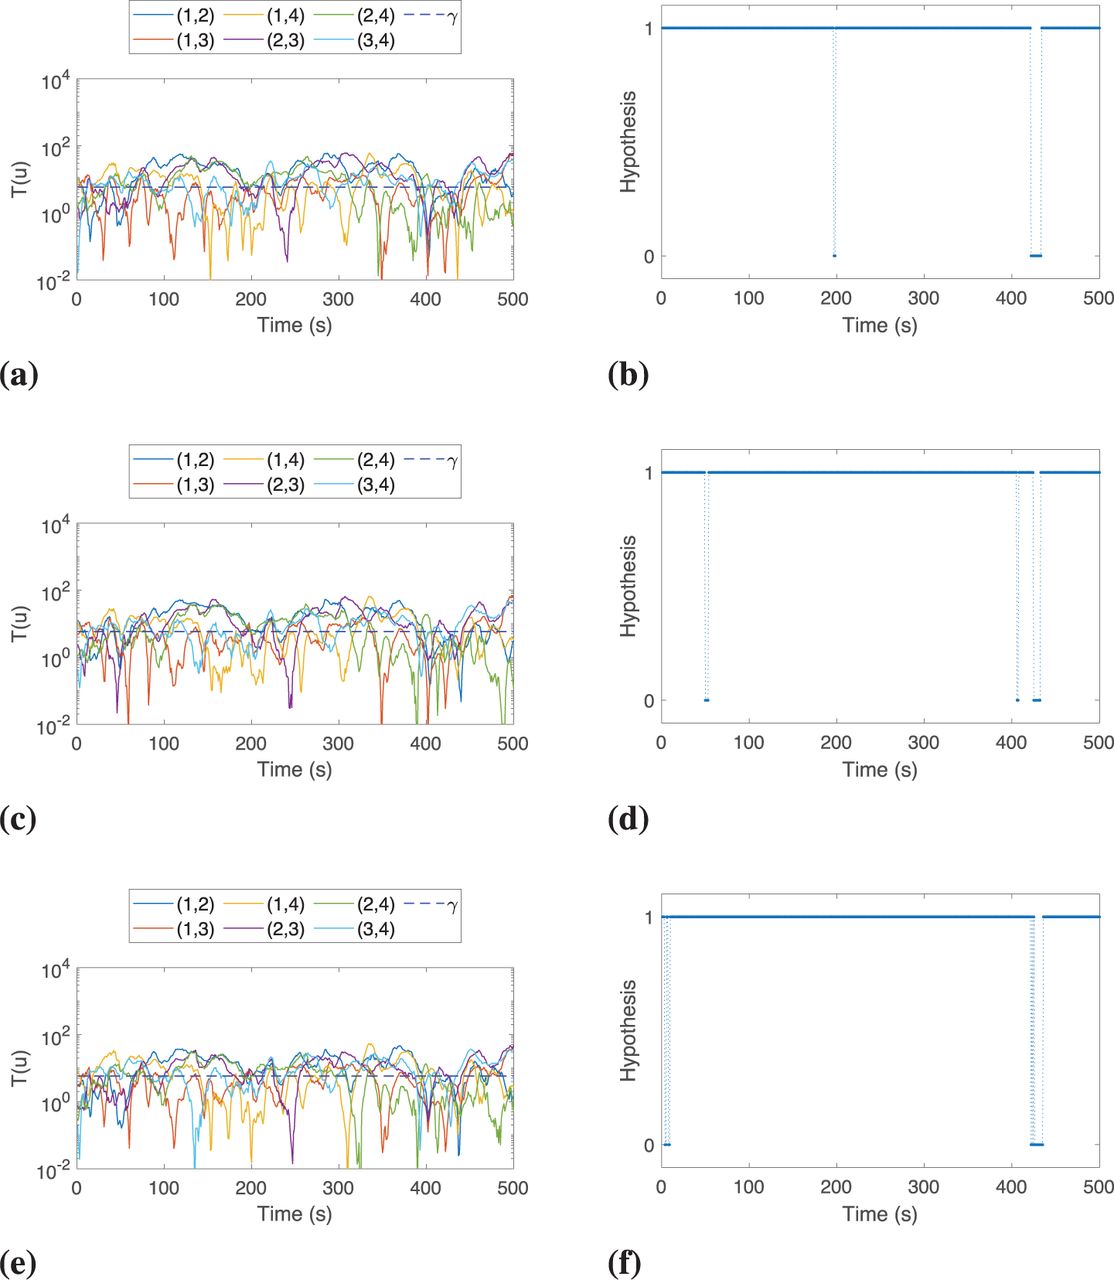
GLRT results of PRN-32 and a spoofing signal: (a) depicts the test statistics of PRN-32 and PRN-17 while (b) depicts the test results of PRN-32 and PRN-17; (c) depicts the test statistics of PRN-32 and PRN-19 while (d) depicts the test results of PRN-32 and PRN-19; and (e) depicts the test statistics of PRN-32 and PRN-28 while (f) depicts the test results of PRN-32 and PRN-28.
For a pair of spoofing signals, the results are shown in Figure 16. Although there are also occasional incorrect decisions, the test statistics remained beneath the threshold most of the time as shown in Figure 16(a), Figure 16(c), and Figure 16(e). In other words, the results show that all spoofing signal combinations were correctly discriminated most of the time of the experiment.

GLRT results of a pair of spoofing signals: (a) depicts the test statistics of PRN-17 and PRN-19 while (b) depicts the test results of PRN-17 and PRN-19; (c) depicts the test statistics of PRN-17 and PRN-28 while (d) depicts the test results of PRN-17 and PRN-28; and (e) depicts the test statistics of PRN-19 and PRN-28 while (f) depicts the test results of PRN-19 and PRN-28.
Overall, during the experiment, the extended PrDD method could correctly discriminate spoofing signals from authentic signals most of the time, which verifies the effectiveness of this method.
5.2 Results of Spoofer Localization
After spoofing discrimination, the position of each receiver and spoofer can be estimated using the proposed QSSL method. Since both the receivers and the spoofer are placed on the ground, Equation (42) must be adopted to estimate spoofer position.
The results are shown in Figure 17. The horizontal position estimations are depicted in Figure 17(a), and the altitude estimations are depicted in Figure 17(b). The root mean square error (RMSE) of the position estimations and ASPE of each receiver and the spoofer are given in Table 1. This table lists the RMSE of the position estimations on each axis. All the four receivers have less RMSE on the East axis than that on the North axis. The RMSE of Receiver 2 is a little bigger than those of other receivers, because Receiver 2 can receive only five of all the eight satellite signals shown in Figure 12. As a result, the ASPE of a receiver is no bigger than 6.2 m2. The ASPE of the spoofer in this experiment was about 43.2 m2. It can be seen that the spoofer localization results assembled around the real position of the spoofer. All localization results were within 16.7 m from the real spoofer position, and 90% of them were within 9.4 m from the real spoofer position.
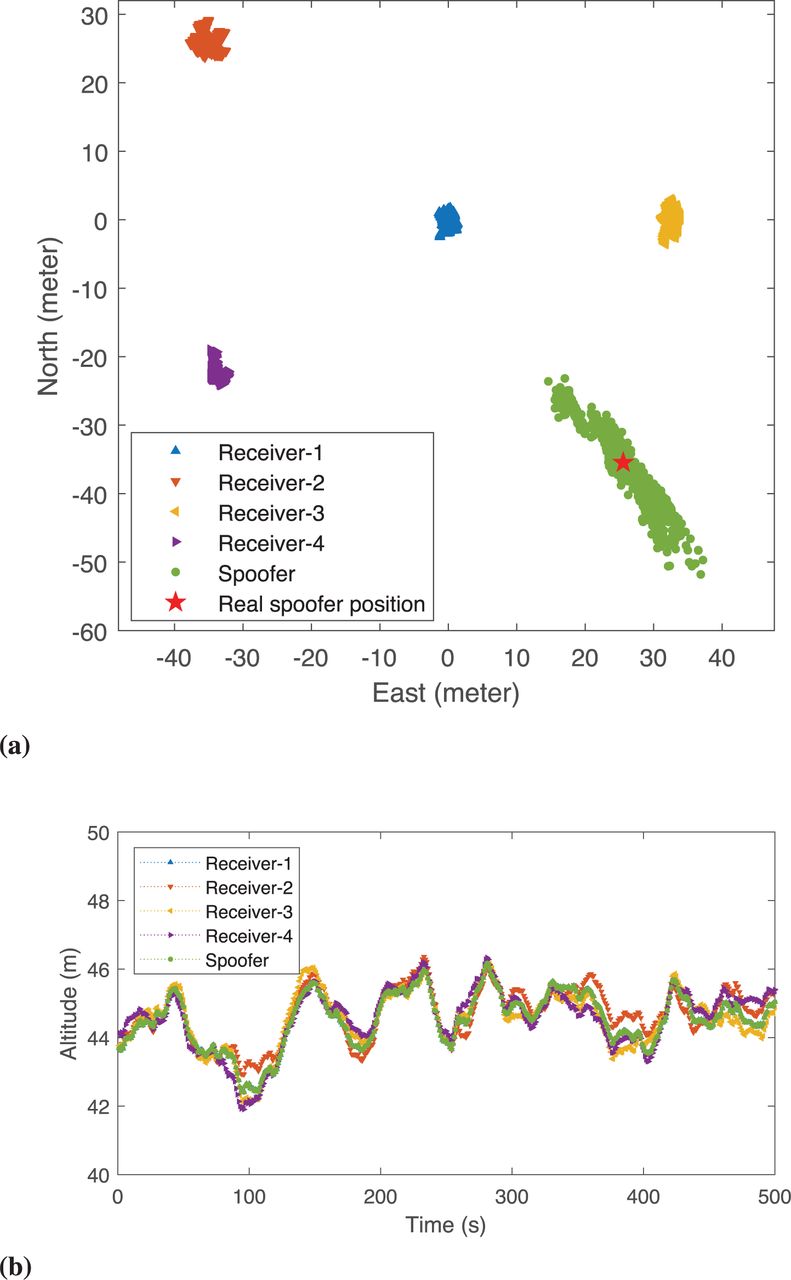
Estimated receiver and spoofer positions. (a) Horizontal position estimations. (b) Altitude estimations.
RMSE and ASPE of position estimations
The results demonstrate that the QSSL method is effective in this field experiment.
6 CONCLUSION
Spoofer localization is an important anti-spoofing technique. To build a flexible spoofer localization system, two major problems are studied in this paper. One is spoofing discrimination without requiring synchronization of multiple receivers, and the other is using an efficient localization method based on asynchronous raw measurements.
First, this paper proposes an extended PrDD method for spoofing discrimination. This method does not require synchronization of multiple receivers and can judge whether the spoofing signals received by different receivers are from the same spoofer. Simulation results show that this method can discriminate spoofing signals with high confidence at any point in a day. Then, the QSSL method was proposed for estimating spoofer position. This method makes use of asynchronous raw measurements of the signals to locate a spoofer, and requires no additional assistance (such as the synchronous peer or calibration emitter employed by previous works). The CRLB of the localization performance was analyzed, and both theoretical analysis and simulations proved that the spoofer position estimation could attain the CRLB. Above all, the field experiment conducted verified the effectiveness of the proposed methods, and further demonstrated that a flexible spoofer localization system is feasible and practical.
HOW TO CITE THIS ARTICLE
Wen, J., Li, H., & Lu, M. (2022) A flexible GNSS spoofer localization system: Spoofing discrimination and localization method. NAVIGATION, 69(1). https://doi.org/10.33012/navi.511
ACKNOWLEDGMENTS
This work was supported by the National Natural Science Foundation of China (Grant No. 61973181) and Tsinghua University Initiative Scientific Research Program (Grant No. 2018Z05JZY004).
APPENDIX A DEDUCTION OF QUASI-SYNCHRONIZED TDOA MEASUREMENTS
 A1
A1
Note that an assumption in Equation (A1) is that δtn and δt1 keep unchanged during the short period of time from t1 to tn. Also, an approximation is made as  . Here,
  is not the distance of spoofer from the n-th receiver, but an imaginary distance between the n-th receiver and the imaginary satellite that is simulated by the spoofer. However, the difference of the real spoofer distances is equal to that of the imaginary satellite distances, so we can use the result in Equation (A1) to estimate spoofer position. The second line of Equation (A1) means the desired range difference should be calculated using raw measurements that are measured at the same time. However, only asynchronous raw measurements are available, so we have the form as the last line of Equation (A1), i.e., the form in Equation (17).
- Received April 9, 2021.
- Revision received October 12, 2021.
- Accepted November 11, 2021.
- © 2022 Institute of Navigation
This is an open access article under the terms of the Creative Commons Attribution License, which permits use, distribution and reproduction in any medium, provided the original work is properly cited.


Jump to section
Related Articles
Cited By...
- No citing articles found.