

Abstract
Deep neural networks (DNNs) are a promising tool for global navigation satellite system (GNSS) positioning in the presence of multipath and non-line-of-sight errors, owing to their ability to model complex errors using data. However, developing a DNN for GNSS positioning presents various challenges, such as (a) poor numerical conditioning caused by large variations in measurements and position values across the globe, (b) varying number and order within the set of measurements due to changing satellite visibility, and (c) overfitting to available data. In this work, we address the aforementioned challenges and propose an approach for GNSS positioning by applying DNN-based corrections to an initial position guess. Our DNN learns to output the position correction using the set of pseudorange residuals and satellite line-of-sight vectors as inputs. The limited variation in these input and output values improves the numerical conditioning for our DNN. We design our DNN architecture to combine information from the available GNSS measurements, which vary both in number and order, by leveraging recent advancements in set-based deep learning methods. Furthermore, we present a data augmentation strategy to reduce overfitting in the DNN by randomizing the initial position guesses. We, first, perform simulations and show an improvement in the initial positioning error when our DNN-based corrections are applied. After this, we demonstrate that our approach outperforms a weighted least squares (WLS) baseline on real-world data. Our implementation is available at github.com/Stanford-NavLab/deep_gnss.
1 INTRODUCTION
In the last decade, deep learning has been applied to several localization applications involving complex and high-dimensional sensor inputs, such as camera images and lidar pointclouds (Choy et al., 2020; Kendall et al., 2015; Wang et al., 2017). Deep learning algorithms utilize labeled data to (a) discover an effective representation, or embedding, of the sensor inputs needed for localization; and (b) to build an approximate model, represented by a deep neural network (DNN), of the sensor input-position output relationship. Since both the embeddings and the model are learned using data, these methods have shown better performance than analytical methods when sensor inputs are affected by environmental factors, such as occlusions and dynamic obstacles (Sünderhauf et al., 2018).
Given the success of deep learning in localization using sensor inputs, it is natural to consider applying deep learning for localization using GNSS measurements. This is especially important for localization in urban and semi-urban environments, where multipath and non-line-of-sight (NLOS) effects add environment-dependent additive biases to GNSS measurements that are challenging to model analytically. The error distributions in GNSS measurements due to these effects are often non-Gaussian, which reduces the accuracy of traditional techniques that rely on Gaussian approximations of the error (Reisdorf et al., 2016; Wen et al., 2020; Zhu et al., 2018). Since DNNs can learn the relationship between the measurements and corresponding positions using data, they offer a promising alternative for localization in urban and semi-urban environments.
Availability of labeled data sets containing ground truth positions is necessary for training a DNN for localization. The recent increase in public data sets containing GNSS pseudorange measurements along with the associated ground truth positions is promising for the development of deep-learning algorithms for GNSS-based localization (Fu et al., 2020). These data sets are collected over different driving scenarios, such as highway, urban, and semi-urban, as well as under different operating conditions. Thus, these data sets provide a variety of input-output pairs for training the DNN.
Although labeled data with GNSS pseudorange measurements is becoming increasingly available, three main challenges must be addressed before this data can be used to train a DNN for localization:
Different Variations in Values of GNSS Data: Satellite positions in the Earth-centered, Earth-fixed (ECEF) frame of reference can take values between [−20, 200, 20, 200] km in all three axes with variations of the same magnitude. On the other hand, GNSS pseudorange measurements have values of around 20,200 km but variations on a much smaller scale, of about 100 m. Similarly, GNSS receiver positions in the ECEF reference frame take values approximately between [−6,000, 6,000] km in all three axes with variations of the same magnitude. The large difference in the ratio of meaningful variations to received values causes the optimization problem of training a DNN to be numerically ill-conditioned, resulting in large changes to the DNN’s parameters at each update and numerical instability (Goodfellow et al., 2016; McKeown et al., 1997). Furthermore, naïvely rescaling the satellite position and pseudorange measurement values risks loss of information necessary for positioning due to the finite precision of floating point operations. Therefore, additional strategies for representing the satellite positions and pseudorange measurements must be considered.
Varying Number and Order of GNSS Measurements: Since the number of visible satellites at a measurement epoch depends on the environment, the set of measurements received at different epochs often contains different numbers of GNSS signals. Additionally, for the same set of measurements, the output of GNSS-based localization algorithms should be independent of the order of measurements within the set. However, most DNN architectures are designed for a fixed number of inputs supplied in a pre-determined order, requiring the use of specialized architectures for GNSS-based localization (Lee et al., 2019; Skianis et al., 2020; Zaheer et al., 2017).
Limitation in Collecting Vast Amounts of Real-World GNSS Data and Ground Truth: Collection of large-scale GNSS data sets for deep learning is limited by the need of ground truth positions associated with the measurements, which requires sophisticated hardware. Therefore, existing GNSS data sets with ground truth are collected at a few locations in the world and at specific times. These data sets are limited both in the geography and in the variety of observed pairs of GNSS measurements and positions. For instance, the ECEF positions of both the receiver and the satellites captured in a data set collected within California will not include the ECEF positions seen in a data set collected within Australia. Using such limited data in deep learning often results in DNN models that overfit the training data and perform poorly on unseen inputs (Goodfellow et al., 2016).
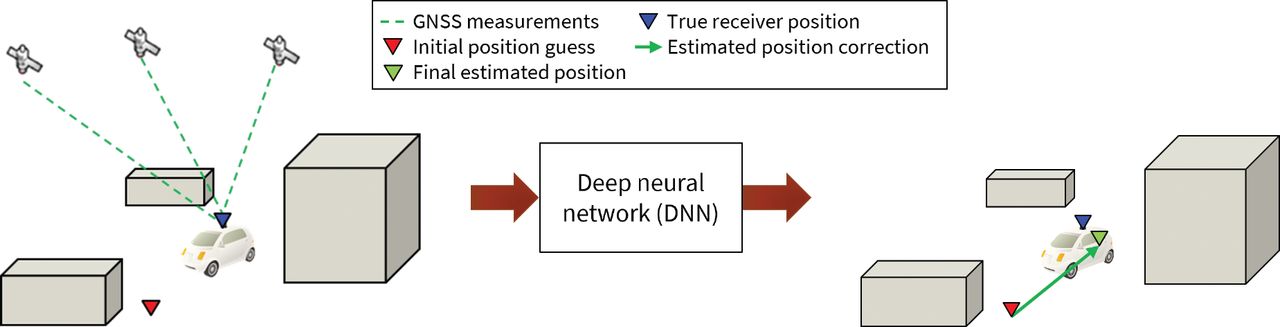
In this work, we address these challenges and develop a deep-learning algorithm for localization using GNSS pseudorange measurements. We propose converting the position estimation problem solved by traditional GNSS positioning algorithms into the problem of estimating position corrections to an initial position guess. In our approach, we use a DNN to learn a functional mapping from GNSS measurements to these position corrections, as illustrated in Figure 1. This paper is based on our work in Kanhere et al. (2021).

Our approach for applying deep learning for GNSS-based localization; given GNSS pseudorange measurements and satellite positions, our method uses a DNN to estimate position corrections to an initial position guess.
The main contributions of our work are:
The designing of a DNN to estimate position corrections to an initial position guess. To our knowledge, our approach is one of the first to use a DNN with outputs directly in the GNSS positioning domain.
The use of a set-based DNN architecture to handle the varying number and order of GNSS inputs at each measurement epoch
The use of numerically conditioned inputs and outputs in a local frame of reference for the DNN; we use residuals and line-of-sight (LOS) vectors as inputs along with position correction outputs in the local north-east-down (NED) frame of reference for numerically stable training and to encourage global applicability of the algorithm.
The development of a geometry-based data augmentation strategy to prevent overfitting in the DNN and improve its generalization to new GNSS measurements; our strategy generates new data points for training the DNN by leveraging the geometric relationship between randomized initial position guesses, residuals, LOS vectors, and position corrections.
4. Validation of the proposed approach on simulations and real-world data from the Android Raw GNSS Measurements data set (Fu et al., 2020)
Our implementation is also publicly available at github.com/Stanford-NavLab/deep_gnss.
The rest of this paper is organized as follows: Section 2 discusses related work; Section 3 gives relevant background on set-based deep learning; Section 4 provides a description of our proposed method including details of numerical conditioning of the DNN input-output values, our data augmentation strategy, and the neural network architecture; Section 5 details our experimental validation on both simulated and real-world data sets; and Section 6 concludes this paper.
2 RELATED WORK
Previous work has primarily used deep learning in the GNSS measurement domain for detecting faulty measurements or estimating pseudorange uncertainty. Hsu (2017) proposes an approach that uses a support vector machine (SVM) for the detection of multipath, LOS, and NLOS measurements. The SVM is given a feature vector consisting of pseudorange residuals, pseudorange rate residuals, and a signal-to-noise ratio for each measurement. The author shows that the SVM improves NLOS, LOS, and multipath detection rates compared to a fixed detection threshold. In Munin et al. (2020), the authors detect multipath signals using a convolutional neural network (CNN) by learning relevant visual features from the receiver correlator output for each satellite measurement. In Zhang et al. (2021), the authors use a combination of long short-term memory (LSTM) and CNNs to predict satellite visibility and pseudorange uncertainty. The LSTM architecture proposed by the authors handles the varying numbers and order of GNSS measurements in detecting multipath signals. However, these previous works (Hsu, 2017; Munin et al., 2020; Zhang et al., 2021) focus on applying deep learning in the GNSS measurement domain and not directly in the GNSS positioning domain.
In line with our proposed approach, several previous works have proposed estimating the pose (position and orientation) from sensor measurements by estimating and applying a correction to an initial pose guess. In Cattaneo et al. (2019), the authors propose a localization approach using a camera image measurement and a lidar map of the environment. The approach trains several DNNs to iteratively correct an initial pose guess based on a learned disparity between the camera image and an expected image constructed from the lidar map. In Peretroukhin and Kelly (2018) the authors generate correction factors within a factor graph using pairwise image measurements from a camera. The correction factor is obtained from a DNN and represents the relative pose between the two pairs of images. Although the idea of estimating position using corrections to an initial guess has been explored in literature, it has not been applied to the problem of GNSS-based positioning using deep learning, which is the focus of this work.
3 DEEP LEARNING ON SETS
Since the visibility of different satellites changes depending on both the location and the time of measurement, GNSS positioning output must be consistent for inputs containing a different number and order of measurements. For example, the position estimated using GNSS measurements from satellites numbered 1–8 must be similar to that estimated using satellites numbered 5–10, even if both the number of measurements and the order in which measurements from the same satellites appear are different in both cases. These inputs of varying size and order are commonly referred to as set-valued inputs, Set-valued inputs pose unique challenges to common DNN architectures, which are designed to operate on inputs with fixed dimensions and are sensitive to the order in which different elements appear within the input (Zaheer et al., 2017).
Recently, DNN architectures that can handle set-valued inputs have been explored in literature (Lee et al., 2019; Skianis et al., 2020; Zaheer et al., 2017). For set-valued inputs comprised of elements in domain  and outputs in domain
  , the objective of these DNN architectures is to learn a function
  such that:
 1
1
 2
2
where  denotes the power set containing all combinations of elements with domain
  ;
;  denotes the i-th set-valued data instance with
  ;
;  denotes the i-th set-valued output; and M(i) is the number of elements in
  , which can vary across data instances.
To operate on sets, Φ satisfies the following two properties:
Order Invariance: For an input
 and its permutation ; which has the same elements as but with a different order defined by the operator π(·), the function output should remain the same, i.e., .
Consistency in Variable Input Size: For inputs
and , with a different number of elements (M ≠ M′), f has well-defined outputs, i.e., .


DNNs equipped to handle set-valued inputs realize these properties in three main process steps: (a) generating input embeddings, (b) aggregating these embeddings, and (c) processing the aggregated embeddings to produce the output (Soelch et al., 2019). In the following description of DNNs for set-valued inputs, we walk through these three steps for applying Φ to a single data instance. Correspondingly, we simplify the notation from X(i) to X.
In the first step, an encoder network Φencoder composed of feed-forward neural network layers individually processes each element xm ∀ m ∈ {1,…, M} within the set-valued input  to obtain corresponding feature embeddings fm such that:
 3
3
For the set input, we denote this encoding process as:
 4
4
where  is the set of all embeddings such that
  .
.
In the second step, the aggregation function combines the embeddings fm into a fixed-size aggregated embedding e of the inputs using an aggregation function Φaggregate:
 5
5
Since the aggregation function Φaggregate combines the embeddings from different input elements in the set to a fixed-size output, Φaggregate can be chosen such that it is number and order invariant.
Finally, in the third step, a decoder network Φdecoder composed of feed-forward neural network layers processes the embedding e to produce the output Y:
 6
6
As a result of the three steps, the overall function  can be represented as:
 7
7
If the aggregation function Φaggregate is chosen to be number and order invariant, the composite function Φ is both invariant to the ordering of the inputs and unaffected by the number of elements. A variety of aggregations Φaggregate that fulfill this criteria have been studied in literature, such as sum, max-pooling, and learned aggregations (Soelch et al., 2019).
A set transformer (Lee et al., 2019) is a particular type of DNN architecture for set-valued inputs that uses learned aggregations to construct the fixed-size input encoding e. In set transformers, the learned aggregations consider interactions between different set elements while combining the embeddings fm. Modeling these element-to-element interactions has shown to perform well in tasks such as clustering, where the effective aggregation needs to be determined from the set elements themselves. Furthermore, these learned aggregations have been shown to perform well for a wide range of hyperparameters (Soelch et al., 2019).
GNSS-based localization benefits from such considerations in modeling element-element interactions because comparisons between different GNSS measurements aid in the detection of multipath and NLOS errors (Mikhailov & Nikandrov, 2012; Savas & Dovis, 2019). Additionally, the set transformer aggregation function Φaggregate is number and order invariant which allows its application to set-valued inputs, such as GNSS measurements. Hence, we employ the set transformer within our DNN architecture to handle set-valued GNSS measurements.
4 PROPOSED METHOD
In this section, we describe our approach for developing a DNN for estimating corrections to an initial position guess using GNSS pseudorange measurements. First, we formulate the problem of estimating position corrections with data values that are numerically well-conditioned for deep learning. Then, we describe the architecture and training process of our DNN that employs a set transformer to process the set-valued inputs derived from GNSS measurements and estimates the position correction. Next, we explain our strategies to overcome the problems of geographic sparsity of data and overfitting. Finally, we illustrate our inference procedure for a new set of GNSS measurements. Figure 2 shows the overall architecture of our algorithm.

View of the overall positioning pipeline; we process input GNSS pseudorange measurements and satellite positions using a DNN to estimate the correction to an initial position estimate.
4.1 Position Correction From GNSS Measurements
At a measurement epoch, typical methods estimate position using GNSS pseudorange measurements,  collected from a position
  in the ECEF frame of reference. Here, i denotes the i-th data instance within the data set of GNSS measurements with M(i) satellites visible from
  . The position
  of the satellite associated with each m-th measurement is available from the ephemerides broadcast by the International GNSS Service (IGS) ground stations. For inputs to typical GNSS localization algorithms, consider the set
  of pairs of pseudoranges with corresponding satellite positions defined as:
 8
8
In a machine-learning setting, the objective is to learn a function  that outputs an estimate
  of the position
  using the input
  for the i-th data instance, where N is total number of instances in the data set:
 9
9
As previously mentioned in Section 1, Equation (9) has poor numerical conditioning for deep learning due to large variations in the input and output values. Therefore, we rewrite Equation (9) as the addition of an estimated position correction  to an initial position guess
  :
:
 10
10
In this new setting, the objective is to learn a function  that outputs an estimate of the position correction
  using the input
  such that:
 11
11
If  is selected in the vicinity of the true position
  , the different values of the true position correction
  are restricted to a small range, as opposed to the large variations in
  , resulting in better conditioning of the output for function
  .
.
To improve the conditioning of the input variables, we consider the pseudorange model (Morton et al., 2021):
 12
12
where  denotes the error in the measurement due to both factors that can be modeled, such as satellite and receiver clock drift and atmospheric effects, as well as factors that are difficult to model analytically, such as the effects of multipath and NLOS signals.
Assuming  , we linearize the expression in Equation (12) about
  :
:
 13
13
 14
14
where  denotes the pseudorange residual (difference between
  and expected pseudorange at
  ) for the m-th satellite and
  denotes the LOS vector for the m-th satellite from
  , both for the i-th data instance.
Thus, given an initial guess  , we convert the set of received measurements
  into a set containing pairs of residuals and corresponding LOS vectors, defined as:
 15
15
which is equivalently represented as:
 16
16
where  and
and  .
.
Assuming  is in the vicinity of the true position, the residuals
  typically vary in the range of tens of meters while the LOS vectors
  are unit constrained. Hence, the measurement set
  defined in Equation (16) is a better conditioned input to the DNN than the received measurement set
  .
.
As a result of the input and output conditioning, the effective objective of the DNN in our approach is to learn a functional mapping Φ such that:
 17
17
To summarize, the input to the network is a set  of residuals with corresponding LOS vectors and the output of the network is the position correction
  at the i-th sample of the data set.
4.2 DNN for Estimating Position Corrections
To obtain the estimated position corrections  from the conditioned set-valued inputs
  using Equation (17), we developed a neural network based on the set transformer (Lee et al., 2019) architecture discussed in Section 3.
Our DNN architecture is comprised of four components that we train together to estimate the position corrections from input set  of residuals and LOS vectors. First, as a part of the encoder Φencoder, a fully connected network, with rectified linear unit (ReLU) activation functions, generates a high-dimensional embedding of each input, comprised of a residual r from
  and the associated LOS vector 1 from
  . Each embedding is a D-dimensional vector and is an instance of a measurement in latent space. Here D is a hyperparameter of the network architecture and can be different after encoding or after aggregation in the network. In this work, we choose D = 64 as the hyperparameter throughout the network. Then, a set transformer encoder based on the set transformer encoder block (Lee et al., 2019) further refines the embeddings by modeling interactions between different set elements. Next, a network for learned aggregation Φaggregate, based on the set transformer pooling block (Lee et al., 2019), determines the influence of each set element on the position correction output and combines the embeddings based on these influences. Finally, a set transformer decoder network Φdecoder, composed of a set transformer decoder and a linear layer (Goodfellow et al., 2016), processes the aggregated embedding to determine the position correction output
  . Section 3 briefly explains the set transformer encoder, aggregation, and decoder blocks. Figure 3 depicts the DNN architecture for our proposed approach.
Architecture of the network consisting of the encoder, the aggregator, and the decoder; features from M satellites are processed by the network into a 3D position correction.
We train the DNN by minimizing the mean squared error (MSE) between a batch of the estimated and the true corrections as the loss function:
 18
18
where Nb is the batch size.
4.3 Strategies for DNN Generalization
While a DNN trained from Equation (17) has access to well-conditioned inputs and outputs, its ability to generalize to new data instances is limited by (a) the geographic sparsity of the data and (b) variations in inputs and outputs encountered during training. In this section, we present strategies to overcome these limitations and improve the generalization capability of the DNN.
4.3.1 Overcoming Geographic Sparsity by Change of Reference Frame
Geographic sparsity arises here because the data set that was used was collected in a fixed region on the globe. The satellite LOS vectors and position corrections in the data collected in one part of the world may significantly differ from those in the data from another part, resulting in measurements from some regions being dis-proportionately represented in a given data set. This disproportionality increases the difficulty in training the DNN to accurately estimate corrections for positions all around the globe, since certain input-output relations might be missing from the data set.
To incentivize the DNN to generalize to inputs from across the globe, we make the input-output behavior independent of the location the data was collected in. We achieve this by changing the frame of reference of the inputs and outputs from the global ECEF frame to the local north-east-down (NED) frame about  . In the inputs, the residuals remain the same while the LOS vectors change. We represent this transformation as:
 19
19
where  and
and  are defined the same as in Equation (16) and
  denotes the transformation from the ECEF frame to the NED frame.
The neural network estimates  by estimating
  , which gets modified according to the transformation:
 20
20
 21
21
where  denotes the transformation from the NED frame to the ECEF frame.
The above mentioned transformation changes the inputs and outputs to a local frame of reference. The modified inputs and outputs make our proposed architecture amenable to measurements from parts of the world that were not seen during the training process, as such measurements are similar to the network’s training data after transformation.
4.3.2 Increasing Data Variation Using Geometry-Based Data Augmentation
Using limited data to train a DNN with several parameters often leads to overfitting, in which the DNN memorizes input-output pairs specific to the training data set (Goodfellow et al., 2016). Data augmentation is a commonly used technique to reduce overfitting, which introduces new data points to the DNN during training by transforming existing training samples based on the problem context.
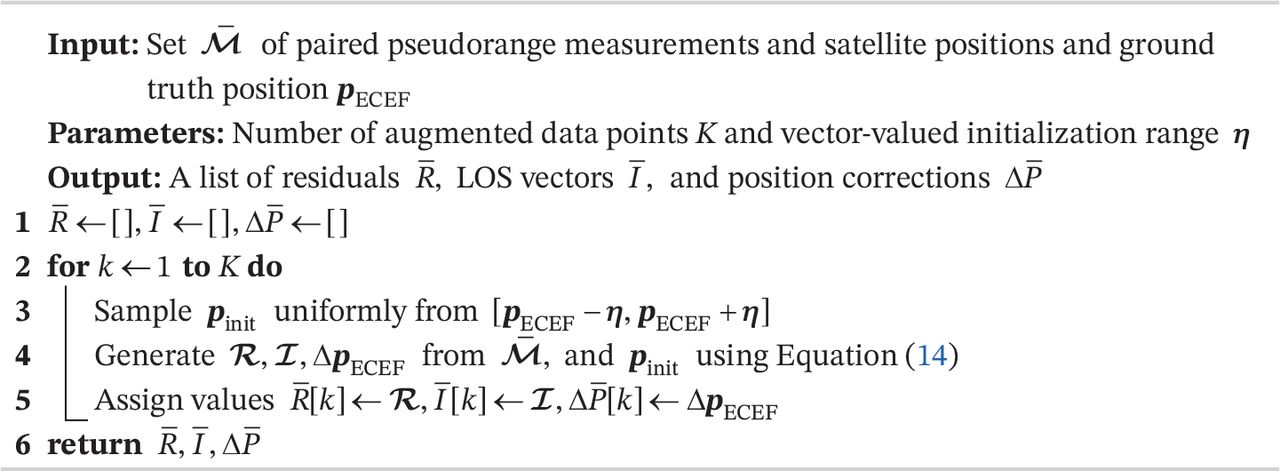
We introduced a geometry-based data augmentation strategy for training a DNN to estimate position corrections from pseudorange measurement residuals and LOS vectors. Algorithm 1 illustrates the process for generating new data points from a data instance. Our augmentation strategy leverages the geometric aspect of GNSS-based positioning by changing the value of the initial position guess  each training epoch to generate new residuals
  , LOS vectors
  , and corrections
  via Equation (14). New initial position guesses are generated by adding zero-mean uniformly distributed noise to the ground truth position p(i). As a result, new samples are generated without any correlation, thus regularizing the training process and allowing the network to better learn the input-output mapping relationship. Finally, the network sees new samples in every training epoch, which prevents it from overfitting the training data.
4.4 Inference
In this section, we illustrate our process to use the trained DNN for estimating the position  from new GNSS pseudorange measurements and the corresponding satellite positions, represented by the set
  .
.

Geometry-Based Data Augmentation
First, we obtain an initial position guess pinit from a traditional localization algorithm or prior knowledge that we assume is in the vicinity of the true position pECFF. Then, we use Equation (17) to determine the input set  that is comprised of pseudorange residuals
  and corresponding LOS vectors
  in the NED reference frame with respect to pinit. Using the set
  as an input to the DNN, we evaluate the position correction in the NED frame
  and convert it to the position correction in the ECEF frame
  . Finally, we add the correction
  to
to  to obtain the position estimate
  using:
 22
22
5 EXPERIMENTS
We validated our approach using a simulated data set and real-world measurements from the Android Raw GNSS Measurements data set (Fu et al., 2020). We used simulations to verify the performance of our network in a setting with controlled measurement errors and access to precise ground truth information. In the validation of real-world data, we compared the accuracy of our proposed approach to that of weighted least squares (WLS; Morton et al., 2021), which is an equivalent traditional localization algorithm and serves as a baseline comparison. In experiments on both data types, we used the same network architecture, optimizer parameters, data generalization method, and other experimental hyperparameters. These parameters are described in Section 5.1 followed by experimental evaluation on the simulated data set in Section 5.2 and an evaluation on the Android Raw GNSS Measurements data set in Section 5.3.
5.1 Experimental Parameters
In our experiments, a fully trained network occupies 611 kB on a disk for 151,107 parameters. We used an instance of the network described in Section 4.2 where the inputs (residuals and LOS vectors) were projected into a latent space of dimension D = 64 by a linear layer, followed by a ReLU activation (Goodfellow et al., 2016). In our implementation, we chose D = 64 as the dimension of the latent spaces in which all projected and embedded features exist.
The projected features were then encoded by two transformer encoder layers (Vaswani et al., 2017) that would operate on the features sequentially. The encoded features were pooled using a pooling attention module (Lee et al., 2019), which was followed by two sequential transformer decoder layers and a linear layer to output the 3D position correction. We did not use batch normalization or dropout techniques at any point in the network architecture.
Our experiments were performed with data batches of 64 samples and the network was trained for 200 epochs. The DNN parameters were optimized using Adam (Kingma & Ba, 2014) with a learning rate α = 3 × 10⁻⁴ as well as a moving window average β1 = 0.9 and β2 = 0.99.
At each training and testing epoch, we generated the initial position guess  by uniformly sampling from the interval [pECEF − η, pECEF + η], where η = η·[1,1,1]T was the vector-valued initialization range with a magnitude η that was the same along each direction. We used initial position guesses with randomly sampled noise added to the true position in all our experiments, except those without data augmentation, for training the network and validating/testing the trained network. The default value in the experimental validations was η = 15 m, which was changed when studying the effect of different η values on the final position estimate.
Additionally, when evaluating the effectiveness of our data augmentation method, we compared our approach to a baseline without data augmentation. In the network without data augmentation, we used a fixed trajectory uniformly sampled from the interval [pECEF − η, pECEF + η]. Here, the term fixed implies that the samples were drawn once to generate the training and validation data sets and have not been changed over any epoch during training.
5.2 Simulated Data Set
We created the simulated data set by (a) generating smooth horizontal trajectories in the NED frame of reference, (b) converting the simulated trajectories to the ECEF frame of reference, and (c) simulating open-sky GNSS measurements for each point along the trajectory.
We simulated the trajectories to imitate real-world data sets, like the Android Raw GNSS Measurements data set (Fu et al., 2020), that are often confined to a limited geographical region and contain samples along vehicle trajectories. We simulate these trajectories based on the approach proposed by Mueller et al. (2015). Note that our network performs snapshot position estimation (i.e., the correlation between samples in the trajectory has no impact on our experimental results).
To generate the measurements for samples from the simulated trajectories, we used the standard pseudorange model (Morton et al., 2021) with the true position and clock states for each instance of data in the converted trajectories  . We did not consider any atmospheric effects or satellite clock biases in simulating the pseudorange measurements. Set
  represents the pairs of simulated pseudorange measurements and the corresponding satellite positions.
For each data instance, measurements were only simulated for satellites that were visible from  , determined using an elevation mask of 5°. Because we used an elevation mask to simulate the measurements, the number of measurements at each instance M(i) varied between 8–10 in our data set. Additionally, we imposed no constraints on the order of the simulated measurements.
We, next, describe the experiments that utilized the simulated data to verify the validity of our approach. Additionally, we investigate the sensitivity of the DNN performance to the choice of measurement errors and the initialization range magnitude η.
5.2.1 Verifying Performance Under Different Measurement Errors
We verified the positioning performance of our DNN in our approach across two scenarios with different error profiles in the pseudorange measurements.
In the first scenario, simulated pseudoranges contained stochastic noise terms that followed a zero-mean Gaussian distribution with a 6–m standard deviation. In the second scenario, we added bias errors along with the zero-mean Gaussian errors in the measurements. The bias errors were sampled from the interval [50, 200] m and were added to pseudoranges picked at random to mimic the effect of multipath and NLOS signals. The number of biased measurements at a time was sampled from a Poisson distribution with rate 1. In both scenarios, we used η = 15 m for generating the initial position guess  . Because the DNN is not restricted by a prior measurement model, we hypothesized that the positioning error for the DNN would be unaffected by the noise scenarios, as long as the DNN encounters the same noise scenario during the training process.
To verify this hypothesis, we evaluated the mean absolute positioning error along the north, east, and down directions, respectively. For both scenarios, the positions estimated by applying corrections from our trained DNN exhibited positioning errors that were less than half the initial value, verifying that our proposed approach is effective in learning a function for positioning using GNSS measurements. These results are summarized in Table 1.
Mean Absolute Error in Position Along Each Direction for Different Simulated Sensor Error Characteristics
5.2.2 Comparing Performance Across Different Initial Positions
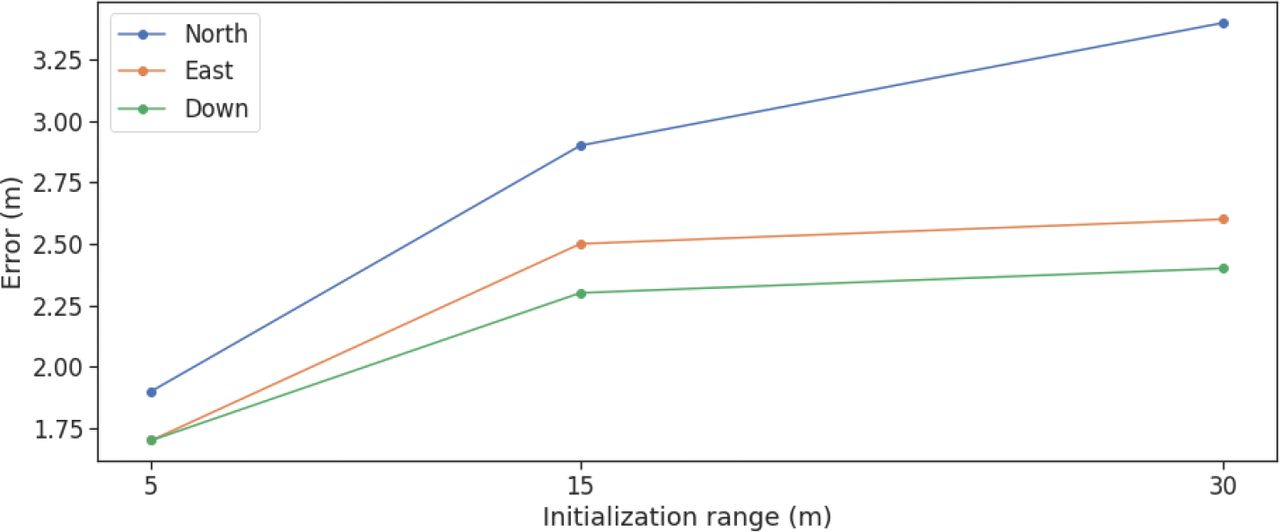
Since the magnitude of the initialization range η determines the maximum initial positioning error, we expected it to have a significant effect on the positioning performance of the DNN. To investigate this, we evaluated the sensitivity of our approach to different choices of η for a scenario with zero-mean Gaussian errors in pseudorange measurements. We considered three different values of η ∈ {5 m, 15 m, 30 m} for training the DNN and compared the positioning performance of the resultant DNN, the results of which are shown in Figure 4.

Sensitivity analysis over various initialization ranges along the north, east, and down directions; the mean absolute error (MAE) in DNN-based position corrections increases when the initialization range increases.
We observed that the positioning error along each of the north, east, and down directions increased as we increased the value of η. However, this increase wasn’t linear and the difference between the positioning errors for η = 15 m and η = 30 m showed less than linear growth. This indicates that, while the positioning error of the DNN does depend on the magnitude of the initialization range η, the impact of η reduces as its magnitude increases.
We attributed the increase in the mean absolute error (MAE) on increasing the initialization range η to primarily two factors. First, the network learns the maximum possible corrections based on the magnitude of the maximum error it sees in the training data set. As a result, outputs for smaller values of η are restricted to smaller ranges, resulting in a smaller MAE. The second factor is that, in increasing η, the network must generalize to a larger set of possible inputs, which increases the overall error in the position estimate.
5.3 Android Raw GNSS Measurements Data Set
The Android Raw GNSS Measurements data set (Fu et al., 2020) consists of GNSS measurements collected using Android phones from multiple driving trajectories executed in the San Francisco Bay Area. This data set has two components: a training component and a testing component. The training component is accompanied by high-accuracy position estimates collected using a NovAtel SPAN system that we used as the ground truth position in our approach. Due to the availability of ground truth positions, we restricted ourselves to the training component because the ground truth provides a reference to both train and evaluate the DNN. Henceforth, we refer to this training component as the data set for evaluating our approach. The GNSS measurements in each trajectory, referred to as traces, include raw pseudoranges, atmospheric biases, satellite clock biases, and satellite positions from at least two Android phones. These measurements, including satellite positions, atmospheric biases, and satellite clock biases, were computed and provided in derived files in the data set. We used these quantities without any modification or additional computations. We treated each unique phone-trace combination as an independent trajectory while validating our approach.
To create the set  for each data instance that was input to the DNN, we used measurements corresponding to GPS L1 signals and processed the raw pseudoranges to remove errors that could be modeled. The corrected pseudorange
  was obtained from values present in the measurement data set by:
 23
23
where  represents the raw pseudorange,
  is the satellite clock bias,
  represents the inter-signal ranging bias,
  is the modeled delay due to ionospheric effects, and
  represents the modeled delay due to tropospheric effects. This process was repeated for all measurements m ∈ {1,…, M} in all data instances i ∈ {1,… N}, where M(i) is the number of measurements in the i-th data instance and there are N data instances in the entire data set.
In our experimental evaluation of the Android data set, we split the data set into three independent parts: (a) a training split (≈ 75% of the data set), (b) a validation split (≈ 10% of the data set), and (c) a testing split (≈ 15% of the data set).
The first split divided the data set into two parts: one for training/validation and another for testing. This division was performed on the trace level and the training/validation and testing data set contained different traces with all corresponding Android measurements from a particular trace associated with either the training/ validation or testing data set. The split between the training/validation and testing data sets was fixed and, therefore, the same for all experiments in this work. The traces belonging to each data set are plotted in Figure 5. The additional split between the training and validation data sets was performed by randomly selecting a ratio of samples from the training/validation traces and using them to validate the network. Each split between the training and validation data sets was stochastic and changed from experiment to experiment. As a result of the data set split, the training data set had 93,195 samples, the validation data set had 10,355 samples, and the testing data set had 16,568 samples.
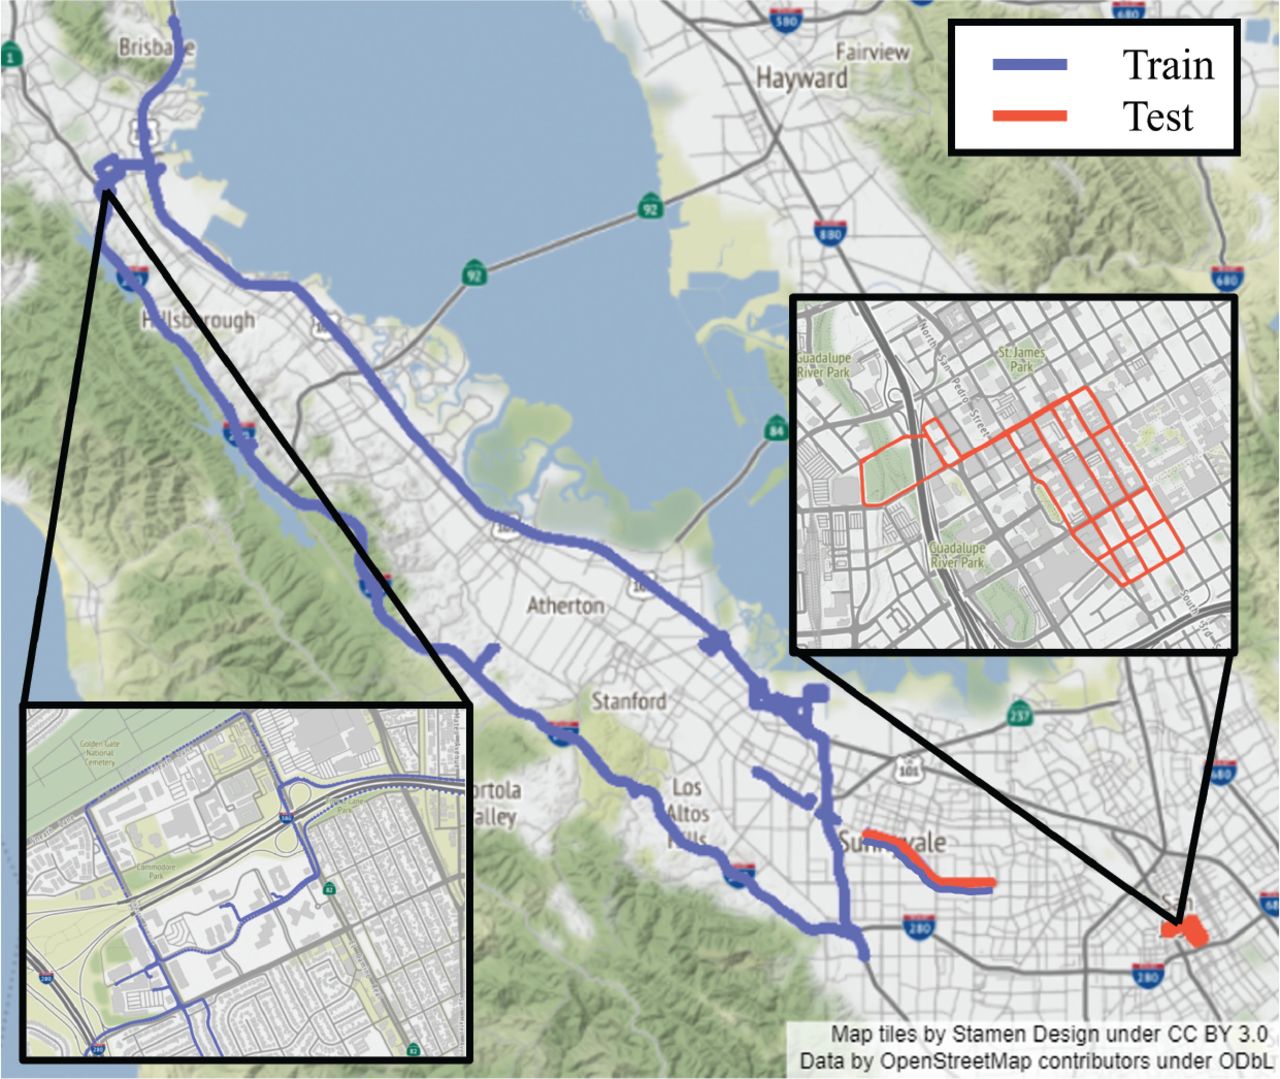
Traces from the Android Raw GNSS Measurements data set used for training/ validation (blue) and testing (red)
5.3.1 Performance Evaluation
We used the training split to train the DNN while the validation split was used to evaluate the DNN during training and ensure that it was learning successfully. We used the testing split to evaluate the performance of different variations of our approach and compared it to the weighted least squares (WLS) baseline.
The WLS baseline position estimates were generated using the open-source goGPS implementation (Herrera et al., 2016). goGPS internally corrects pseudoranges by removing estimated atmospheric delays, satellite clock biases, and other modeled biases. An elevation mask of 10° was applied to the received measurements and the remaining measurements were weighed using the default elevation-based weights from goGPS. The WLS output contained a 3D position estimate along with a clock bias estimate, of which we compared only the positions of those obtained by our proposed architecture.
We evaluated the performance of our proposed DNN with NED corrections and data augmentation using η = 15 m to our approach without augmentation, our approach with data augmentation using η = 30 m, and the WLS baseline. This evaluation was performed on the entire testing data set and our experiments show that our approach with η = 15 m performed the best out of all variations, both in terms of MAE (listed in Table 2) and cumulative distribution function (CDF) plots of the errors (shown in Figure 7). We also evaluated a network that predicted positions directly, instead of predicting corrections to an initial position. However, such an approach showed a MAE in the order of 103 m along all directions and was not investigated further or compared to other methods.
Mean Absolute Positioning Error Along the North, East, and Down Directions in the Estimate of the WLS Baseline and Variations of our Approach
Of the three variations of our method that we evaluated, turning off the data augmentation had the least negative impact on the performance of the neural network. This difference was particularly noticeable in the north direction where the CDF curve deviations from the best case and an additional mean error of approximately 0.8 m were observed. The differences along the east and down directions were not as evident, with an additional mean error of 0.15 m to 0.25 m and having virtually indistinguishable CDF curves.
Similar to our observations from the simulated data, increasing the initialization range η increased the MAE and caused a perceptible drop in the CDF curve for the same error values. Performance of the WLS baseline was poorer than both networks initialized with η = 15 m in all three directions. However, the WLS baseline outperformed the network initialized with η = 30 m in the north and east directions while still performing poorly in the down direction.
This difference is further evidenced by a comparison of the error quantiles between our approach with η = 15 m, our approach with η = 30 m, and the WLS baseline, as shown in Figure 8. Our approach with η = 15 m outperformed the WLS baseline in all directions. However, with η = 30 m, our approach was only able to outperform WLS in the down direction. Similar to the simulated data, there was a strong correlation between the accuracy and the largest magnitude of the initial error, which is currently a limitation of the proposed work.
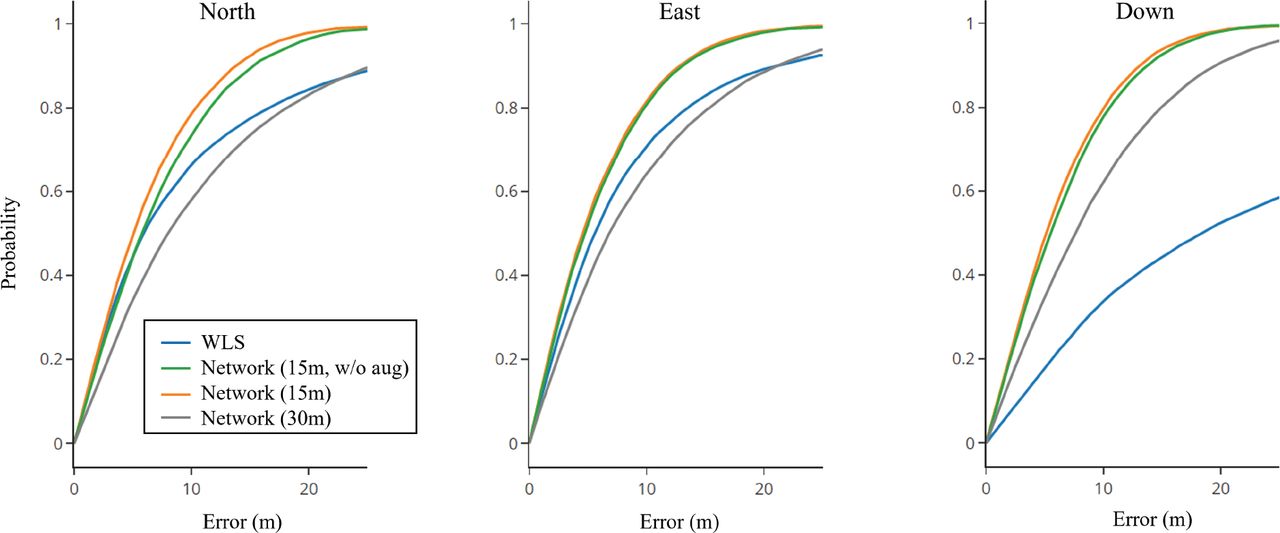
Cumulative distribution function (CDF) of the absolute error in position on test data along the local north, east, and down directions for our approach with η = 15 m, our approach without data augmentation, our approach with η = 30 m, and the WLS baseline
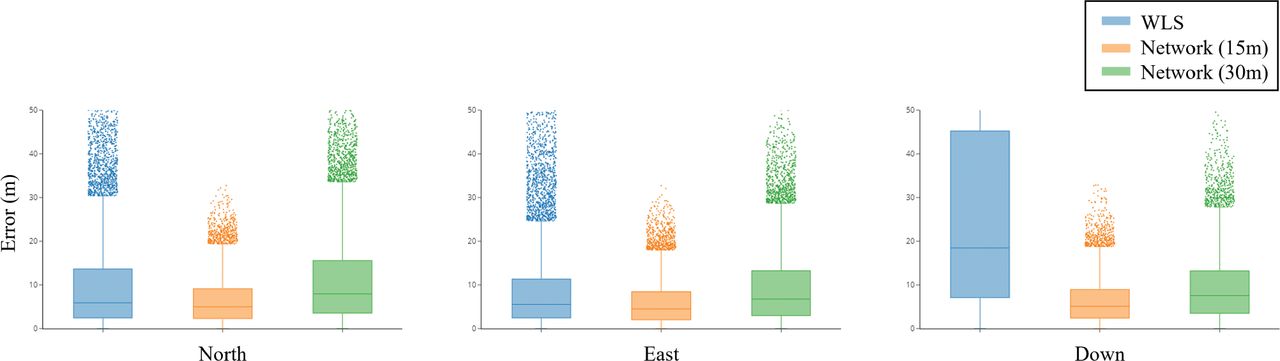
Localization error on the Android Raw GNSS Measurements data set (Fu et al., 2020) in the north, east, and down directions, respectively, for WLS and our approach (initialization range η is 15 m and 30 m); the shaded regions cover the first quantile Q1 to the third quantile Q3, with the horizontal line representing the median.
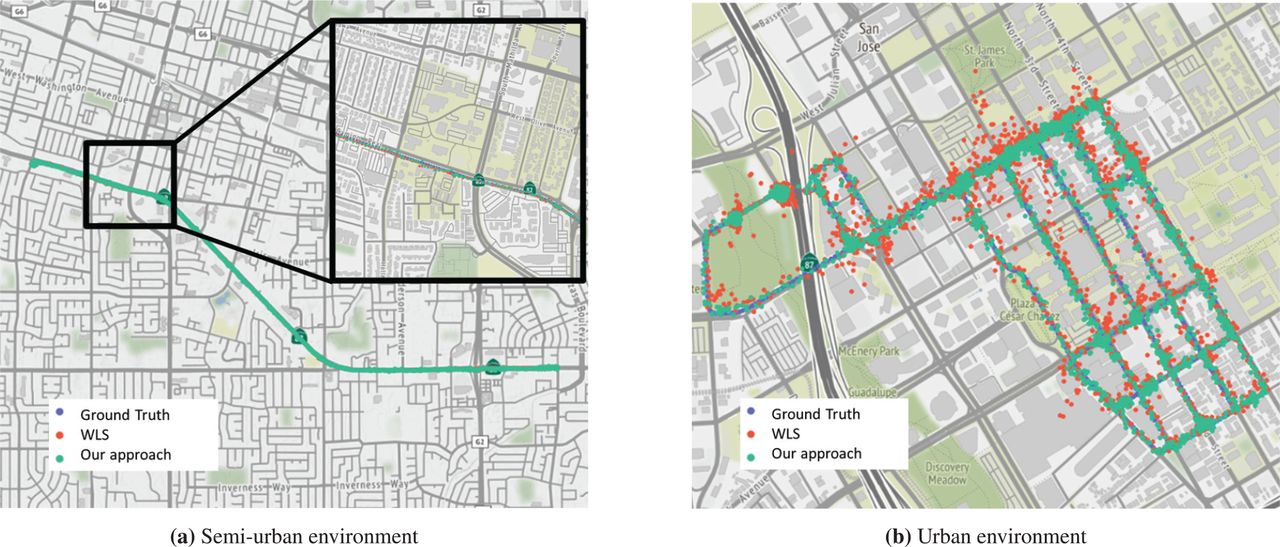
Figure 8 also demonstrates that the network learns the largest magnitude of error in the training data set and bounds the estimated position correction using this information. This also results in the improved performance of networks with smaller initialization ranges η that provide corrections with correspondingly smaller magnitudes. The network’s initial guess is always within a certain range of the ground truth; because of which, the network’s final estimate is also relatively closer to the ground truth solution. This results in our approach’s superior performance on data not seen during training, like the urban case visualized in Figure 6. The semi-urban case visualized in Figure 6 is similar to data encountered by the network during training and, consequently, the network performed as expected in that case.

Example of localized trajectories on the Android Raw GNSS Measurements data set (Fu et al., 2020) for (a) semi-urban and (b) urban environment conditions; the trajectory estimated using our approach is visually similar to WLS in the semi-urban environment and appears closer to the ground truth than the urban environment.
6 CONCLUSION
In this work, we proposed an approach to use a deep neural network (DNN) with GNSS measurements to provide a position estimate. Our proposed approach is the first, to our knowledge, that works with GNSS measurements to provide outputs in the position domain.
To obtain a position estimate, we converted the traditional position estimation problem to that of estimating position corrections to an initial position guess using a DNN. Our proposed approach addresses the challenge of set-based GNSS inputs that vary in number and order by utilizing the set transformer in the DNN architecture. We proposed using pseudorange residuals and LOS vectors from the initial position guess as inputs and NED position corrections as outputs to the DNN. This particular choice of inputs and outputs improves the numerical conditioning of the DNN and provides a natural method to extend our approach to other global regions. Additionally, to reduce overfitting on training data and incentivize the DNN to learn a functional map between the measurements and position corrections, we developed a geometry-based data augmentation method.
We validated our proposed approach on both simulated and real-world data. Experiments performed on the simulated data showed that the position corrections provided by the DNN reduced the mean absolute localization error in each of the north, east, and down directions from the error in the initial position guess, indicating that the DNN effectively learns to solve the positioning problem. Experiments on real-world data demonstrated that the performance of the DNN is sensitive to the error present in the initial position guess. Comparison of the absolute localization error to a weighted least squares (WLS) baseline showed that our approach outperforms WLS along the vertical direction when initialized with position errors within 15 m as well as 30 m. Our experimentation also validates that our data augmentation technique improves the network’s performance when compared to a similar network without data augmentation.
This work validates that using DNNs for GNSS-based localization is a promising and interesting area of research. Our current approach is a snapshot method limited to using simple features. Additionally, both of our training and testing data sets were entirely from the San Francisco Bay Area, which does not provide geographical diversity. In the future, we plan to validate our proposed method on diverse testing data sets collected from locations around the globe. We also plan to extend our approach to sequential position estimation while considering additional measurements such as signal-to-noise-ratio and Doppler. Furthermore, we are considering performing a more detailed parametric study to investigate the effect of hyperparameter values, the use of additional regularization methods, and an iterative positioning correction approach similar to CMR Net (Cattaneo et al., 2019). Our proposed work is also limited by its reliance on close initial guesses and the sensitivity to initialization ranges, which we will also address in future work.
HOW TO CITE THIS ARTICLE
Gao, G., Kanhere, A., Gupta, S., & Shetty, A. (2022). Improving GNSS positioning using neural-network-based corrections. NAVIGATION, 69(4). https://doi.org/10.33012/navi.548
ACKNOWLEDGMENTS
Some of the computing for this project was performed on the Sherlock cluster. We would like to thank Stanford University and the Stanford Research Computing Center for providing the computational resources and support that contributed to this research.
Footnotes
* These authors contributed equally to this work
This is an open access article under the terms of the Creative Commons Attribution License, which permits use, distribution and reproduction in any medium, provided the original work is properly cited.


Jump to section
Related Articles
Cited By...
- No citing articles found.